

वास्तविक पैटर्न

पैटर्न ग्राफिकल मॉडल हैं जो चार्ट में मूल्य से बने होते हैं। तकनीकी विश्लेषण भविष्यवाणियों में से एक के अनुसार, इतिहास का मतलब मूल्य आंदोलन खुद को दोहराता है। इसका मतलब है कि मूल्य आंदोलन अक्सर एक ही परिस्थितियों में समान होते हैं जो उच्च संभावना के साथ स्थिति के आगे के विकास की भविष्यवाणी करना संभव बनाता है।
इंस्टा फॉरेक्स द्वारा प्रासंगिक पैटर्न एक उपयोग में आसान सेवा है जो आपको बाजार में नवीनतम परिवर्तनों के बारे में जागरूक होने और समय पर बाजार से संकेतों पर प्रतिक्रिया करने की अनुमति देती है। हमारी सेवा में आप हमेशा किसी भी जोड़ी और किसी भी समय सीमा पर नवीनतम और सबसे प्रासंगिक पैटर्न प्राप्त कर सकते हैं.
Bearish Rectangle
was formed on 31.03 at 13:33:20 (UTC+0)
signal strength 2 of 5
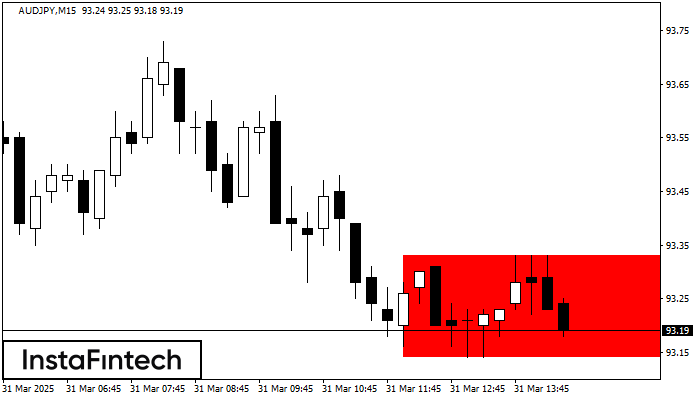
According to the chart of M15, AUDJPY formed the Bearish Rectangle. This type of a pattern indicates a trend continuation. It consists of two levels: resistance 93.33 - 0.00 and support 93.14 – 93.14. In case the resistance level 93.14 - 93.14 is broken, the instrument is likely to follow the bearish trend.
The M5 and M15 time frames may have more false entry points.
See Also
- All
- All
- Bearish Rectangle
- Bearish Symmetrical Triangle
- Bearish Symmetrical Triangle
- Bullish Rectangle
- Double Top
- Double Top
- Triple Bottom
- Triple Bottom
- Triple Top
- Triple Top
- All
- All
- Buy
- Sale
- All
- 1
- 2
- 3
- 4
- 5
Triple Top
was formed on 11.04 at 05:50:16 (UTC+0)
signal strength 1 of 5
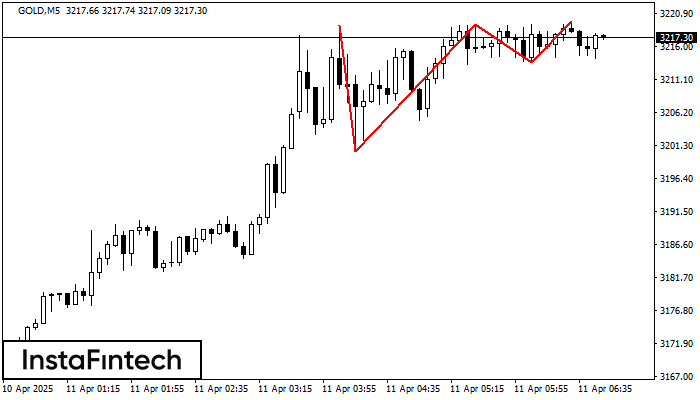
Corak Triple Top telah dibentuk pada carta bagi instrumen dagangan GOLD M5. Ia adalah corak pembalikan yang memaparkan ciri-ciri berikut: tahap rintangan -62, tahap sokongan -1317, dan lebar corak 1857
Carta masa M5 dan M15 mungkin mempunyai lebih banyak titik kemasukan palsu.
Open chart in a new window
Double Bottom
was formed on 11.04 at 05:45:06 (UTC+0)
signal strength 2 of 5
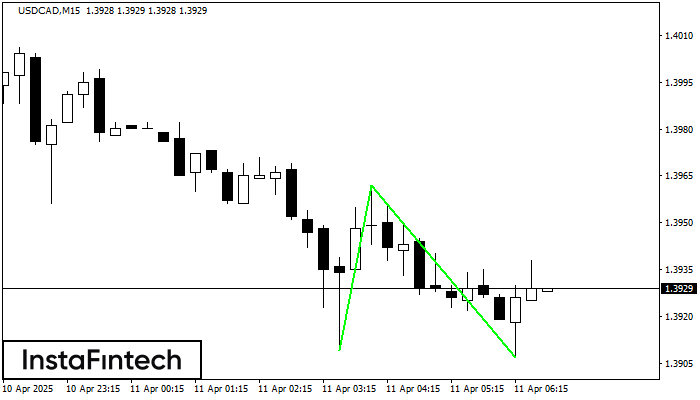
Corak Double Bottom telah dibentuk pada USDCAD M15. Pembentukan ini menandakan pembalikan aliran dari aliran menurun ke atas. Isyarat ialah perdagangan membeli harus dibuka selepas sempadan atas corak 1.3962 telah
Carta masa M5 dan M15 mungkin mempunyai lebih banyak titik kemasukan palsu.
Open chart in a new window
Double Top
was formed on 11.04 at 04:00:34 (UTC+0)
signal strength 4 of 5
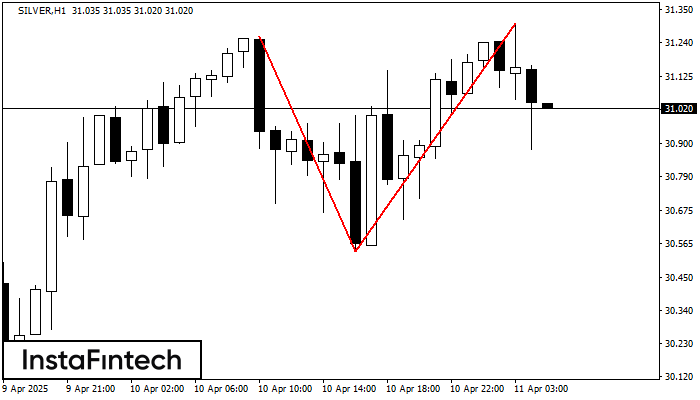
Corak pembalikan Double Top telah dibentuk pada SILVER H1. Ciri-ciri: sempadan atas %P0.000000; sempadan bawah 31.26; sempadan bawah 30.54; lebar corak adalah 765 mata. Dagangan menjual adalah lebih baik untuk
Open chart in a new window


