

वास्तविक पैटर्न

पैटर्न ग्राफिकल मॉडल हैं जो चार्ट में मूल्य से बने होते हैं। तकनीकी विश्लेषण भविष्यवाणियों में से एक के अनुसार, इतिहास का मतलब मूल्य आंदोलन खुद को दोहराता है। इसका मतलब है कि मूल्य आंदोलन अक्सर एक ही परिस्थितियों में समान होते हैं जो उच्च संभावना के साथ स्थिति के आगे के विकास की भविष्यवाणी करना संभव बनाता है।
इंस्टा फॉरेक्स द्वारा प्रासंगिक पैटर्न एक उपयोग में आसान सेवा है जो आपको बाजार में नवीनतम परिवर्तनों के बारे में जागरूक होने और समय पर बाजार से संकेतों पर प्रतिक्रिया करने की अनुमति देती है। हमारी सेवा में आप हमेशा किसी भी जोड़ी और किसी भी समय सीमा पर नवीनतम और सबसे प्रासंगिक पैटर्न प्राप्त कर सकते हैं.
Bullish Flag
was formed on 10.03 at 13:49:20 (UTC+0)
signal strength 3 of 5
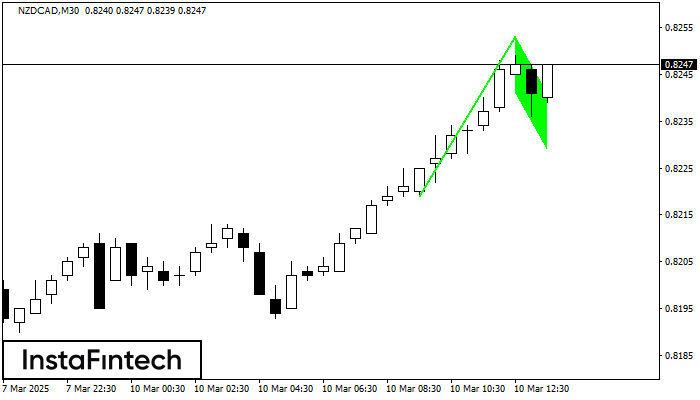
The Bullish Flag pattern has been formed on the chart NZDCAD M30 which signals that the upward trend will continue. Signals: а break of the peak at 0.8253 may push the price higher, and the rise will be the projection of the pole.
- All
- All
- Bearish Rectangle
- Bearish Symmetrical Triangle
- Bearish Symmetrical Triangle
- Bullish Rectangle
- Double Top
- Double Top
- Triple Bottom
- Triple Bottom
- Triple Top
- Triple Top
- All
- All
- Buy
- Sale
- All
- 1
- 2
- 3
- 4
- 5
Double Top
сформирован 24.04 в 20:20:14 (UTC+0)
сила сигнала 1 из 5
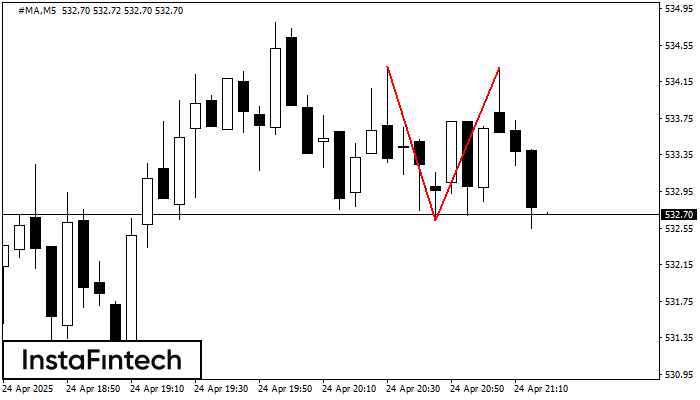
The Double Top reversal pattern has been formed on #MA M5. Characteristics: the upper boundary 534.32; the lower boundary 532.63; the width of the pattern is 168 points. Sell trades
The M5 and M15 time frames may have more false entry points.
Открыть график инструмента в новом окне
Double Top
сформирован 24.04 в 20:00:20 (UTC+0)
сила сигнала 2 из 5
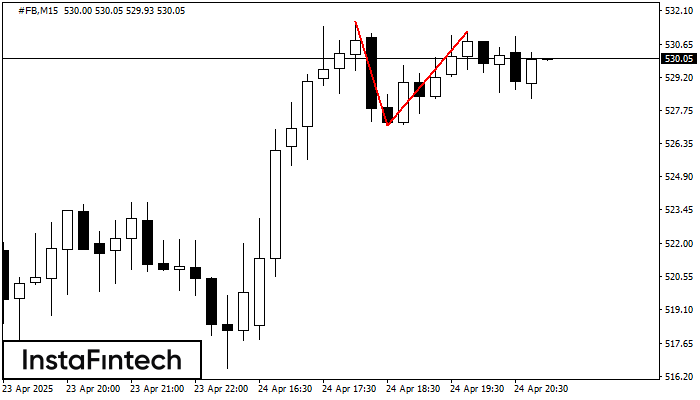
On the chart of #FB M15 the Double Top reversal pattern has been formed. Characteristics: the upper boundary 531.20; the lower boundary 527.14; the width of the pattern 406 points
The M5 and M15 time frames may have more false entry points.
Открыть график инструмента в новом окне
Triple Top
сформирован 24.04 в 19:50:28 (UTC+0)
сила сигнала 1 из 5
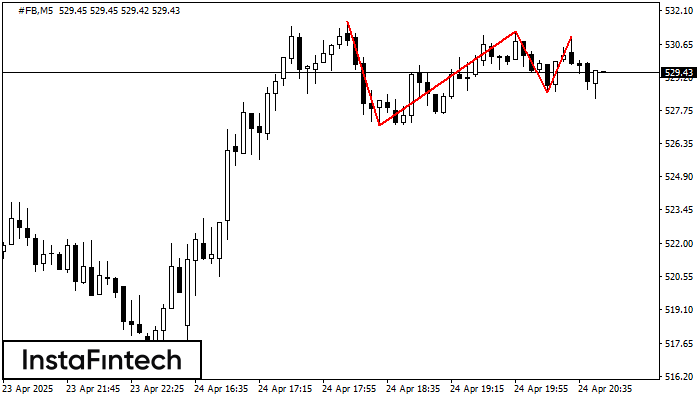
On the chart of the #FB M5 trading instrument, the Triple Top pattern that signals a trend change has formed. It is possible that after formation of the third peak
The M5 and M15 time frames may have more false entry points.
Открыть график инструмента в новом окне


