यह भी देखें


 09.05.2023 07:03 AM
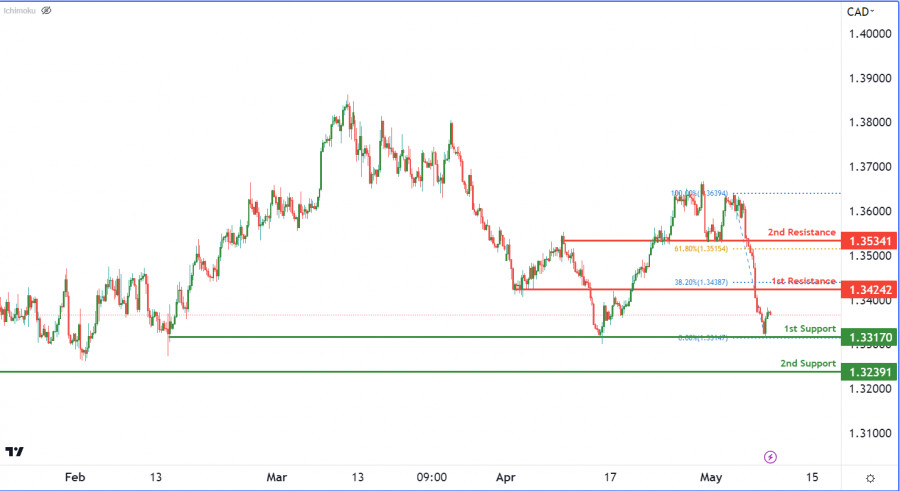
The USD/CAD chart indicates bullish momentum, with potential for further upward movement. The overall momentum is bullish, suggesting that prices could rise in the near future. A bullish continuation towards the 1st resistance level is possible. There are two support levels to monitor if prices fall: the multi-swing low support level at 1.3317 and the swing low support level at 1.3239. On the upside, two resistance levels are noteworthy: the pullback resistance level at 1.3424, which coincides with the 38.20% Fibonacci retracement level, and the pullback resistance level at 1.3534, which coincides with the 61.80% Fibonacci retracement level.
You have already liked this post today
*यहां पर लिखा गया बाजार विश्लेषण आपकी जागरूकता बढ़ाने के लिए किया है, लेकिन व्यापार करने के लिए निर्देश देने के लिए नहीं |
AUD/JPY मुद्रा जोड़ी की चाल और Stochastic Oscillator संकेतक के बीच अभिसरण (Convergence) दिखाई देने के साथ-साथ इसकी कीमत का WMA (21) के ऊपर होना और 4-घंटे के चार्ट में
आंकड़ों में इंस्टाफॉरेक्स

Your IP address shows that you are currently located in the USA. If you are a resident of the United States, you are prohibited from using the services of InstaFintech Group including online trading, online transfers, deposit/withdrawal of funds, etc.
If you think you are seeing this message by mistake and your location is not the US, kindly proceed to the website. Otherwise, you must leave the website in order to comply with government restrictions.
Why does your IP address show your location as the USA?
Please confirm whether you are a US resident or not by clicking the relevant button below. If you choose the wrong option, being a US resident, you will not be able to open an account with InstaTrade anyway.
We are sorry for any inconvenience caused by this message.

