

Pola sebenarnya

Double Bottom
was formed on 24.04 at 08:30:24 (UTC+0)
signal strength 3 of 5
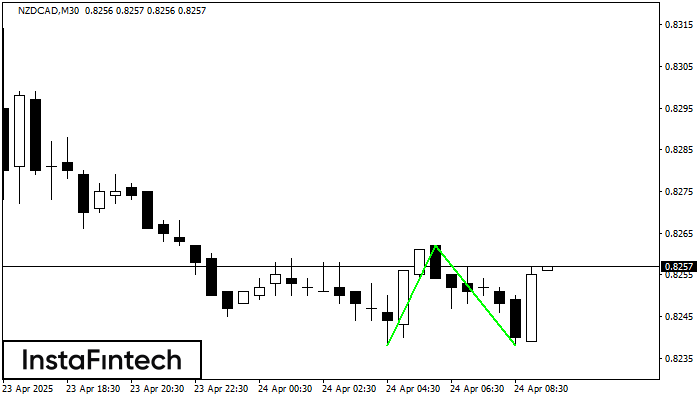
The Double Bottom pattern has been formed on NZDCAD M30. This formation signals a reversal of the trend from downwards to upwards. The signal is that a buy trade should be opened after the upper boundary of the pattern 0.8262 is broken. The further movements will rely on the width of the current pattern 24 points.
- All
- All
- Bearish Rectangle
- Bearish Symmetrical Triangle
- Bearish Symmetrical Triangle
- Bullish Rectangle
- Double Top
- Double Top
- Triple Bottom
- Triple Bottom
- Triple Top
- Triple Top
- All
- All
- Buy
- Sale
- All
- 1
- 2
- 3
- 4
- 5
Panji Bearish
was formed on 28.05 at 08:12:58 (UTC+0)
signal strength 1 of 5

Pola Panji Bearish telah terbentuk di grafik GBPJPY M5. Pola ini memberikan sinyal potensi kelanjutan tren yang ada. Spesifikasi: titik terendah pola berkoordinat di 194.35; proyeksi titik tertinggi sama dengan
Rangka waktu M5 dan M15 mungkin memiliki lebih dari titik entri yang keliru.
Open chart in a new window
Segitiga Simetris Bullish
was formed on 28.05 at 07:55:36 (UTC+0)
signal strength 1 of 5

Menurut Grafik dari M5, GBPAUD dibentuk pola Segitiga Simetris Bullish, yang menunjukkan tren akan berlanjut. Deksripsi. Batas atas dari pola menyentuh kordinat 2.0988/2.0939 dimana batas yang lebih rendah berada sepanjang
Rangka waktu M5 dan M15 mungkin memiliki lebih dari titik entri yang keliru.
Open chart in a new window
Segitiga Simetris Bearish
was formed on 28.05 at 07:55:12 (UTC+0)
signal strength 1 of 5

Menurut Grafik dari M5, NZDJPY dibentuk pola Segitiga Simetris Bearish. Deskripsi: Batas yang lebih rendah adalah 85.44/85.92 dan batas atas adalah 86.64/85.92. Lebar pola diukur dalam grafik di -120 pips
Rangka waktu M5 dan M15 mungkin memiliki lebih dari titik entri yang keliru.
Open chart in a new window


