Bullish Symmetrical Triangle
was formed on 23.04 at 21:33:58 (UTC+0)
signal strength 2 of 5

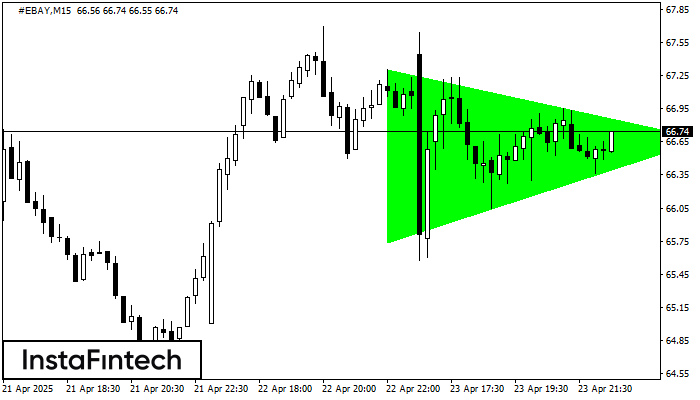
According to the chart of M15, #EBAY formed the Bullish Symmetrical Triangle pattern. Description: This is the pattern of a trend continuation. 67.31 and 65.74 are the coordinates of the upper and lower borders respectively. The pattern width is measured on the chart at 157 pips. Outlook: If the upper border 67.31 is broken, the price is likely to continue its move by 66.89.
The M5 and M15 time frames may have more false entry points.
- All
- All
- Bearish Rectangle
- Bearish Symmetrical Triangle
- Bullish Rectangle
- Double Top
- Double Top
- Triple Bottom
- Triple Bottom
- Triple Top
- Triple Top
- All
- All
- Buy
- Sale
- All
- 1
- 2
- 3
- 4
- 5
Persegi Bullish
was formed on 09.05 at 19:25:18 (UTC+0)
signal strength 1 of 5
Menurut grafik dari M5, EURJPY terbentuk Persegi Bullish. Pola menunjukkan kelanjutan tren. Batas atas adalah 163.61, batas lebih rendah adalah 163.49. Sinyal berarti posisi beli harus dibuka diatas batas atas
Rangka waktu M5 dan M15 mungkin memiliki lebih dari titik entri yang keliru.
Open chart in a new window
Bawah Ganda
was formed on 09.05 at 19:20:18 (UTC+0)
signal strength 1 of 5
Pola Bawah Ganda telah terbentuk pada #EBAY M5; batas atas di 69.84; batas bawah di 69.43. Lebar pola sebesar 42 poin. Jika harga menembus batas atas 69.84, Perubahan dalam tren
Rangka waktu M5 dan M15 mungkin memiliki lebih dari titik entri yang keliru.
Open chart in a new window
Bawah Ganda
was formed on 09.05 at 17:59:49 (UTC+0)
signal strength 1 of 5
Pola Bawah Ganda telah terbentuk pada #INTC M5; batas atas di 21.03; batas bawah di 20.90. Lebar pola sebesar 14 poin. Jika harga menembus batas atas 21.03, Perubahan dalam tren
Rangka waktu M5 dan M15 mungkin memiliki lebih dari titik entri yang keliru.
Open chart in a new window