

Pola sebenarnya

Triple Top
was formed on 23.04 at 21:20:48 (UTC+0)
signal strength 1 of 5
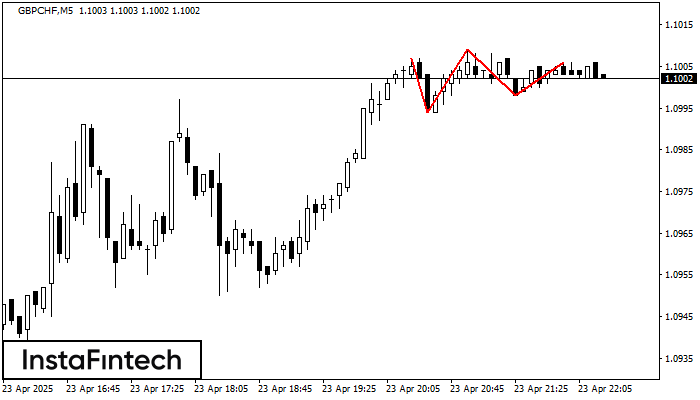
On the chart of the GBPCHF M5 trading instrument, the Triple Top pattern that signals a trend change has formed. It is possible that after formation of the third peak, the price will try to break through the resistance level 1.0994, where we advise to open a trading position for sale. Take profit is the projection of the pattern’s width, which is 13 points.
The M5 and M15 time frames may have more false entry points.
Lihat juga
- All
- All
- Bearish Rectangle
- Bearish Symmetrical Triangle
- Bearish Symmetrical Triangle
- Bullish Rectangle
- Double Top
- Double Top
- Triple Bottom
- Triple Bottom
- Triple Top
- Triple Top
- All
- All
- Buy
- Sale
- All
- 1
- 2
- 3
- 4
- 5
Persegi Bullish
was formed on 27.05 at 21:58:31 (UTC+0)
signal strength 2 of 5
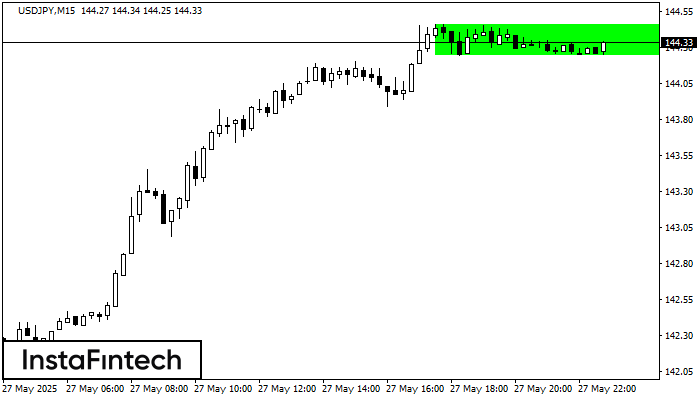
Menurut grafik dari M15, USDJPY terbentuk Persegi Bullish. Pola menunjukkan kelanjutan tren. Batas atas adalah 144.46, batas lebih rendah adalah 144.24. Sinyal berarti posisi beli harus dibuka diatas batas atas
Rangka waktu M5 dan M15 mungkin memiliki lebih dari titik entri yang keliru.
Open chart in a new window
Teratas Ganda
was formed on 27.05 at 21:55:25 (UTC+0)
signal strength 1 of 5
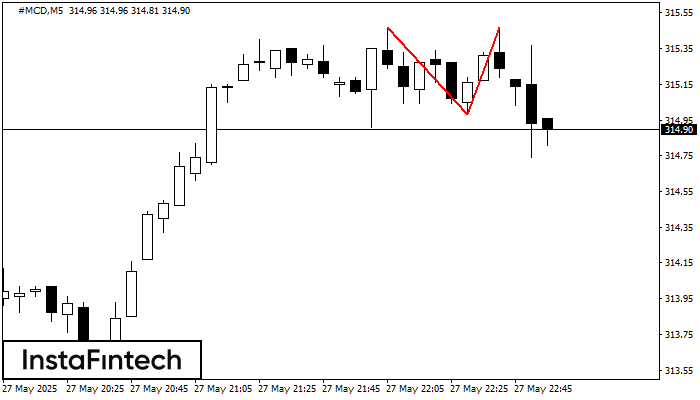
Pola reversal Teratas Ganda telah terbentuk pada #MCD M5. Karakteristik: batas atas 315.47; batas bawah 314.98; lebar pola 49 poin. Transaksi jual lebih baik dibuka di bawah batas bawah 314.98
Rangka waktu M5 dan M15 mungkin memiliki lebih dari titik entri yang keliru.
Open chart in a new window
Bawah Triple
was formed on 27.05 at 21:55:18 (UTC+0)
signal strength 1 of 5
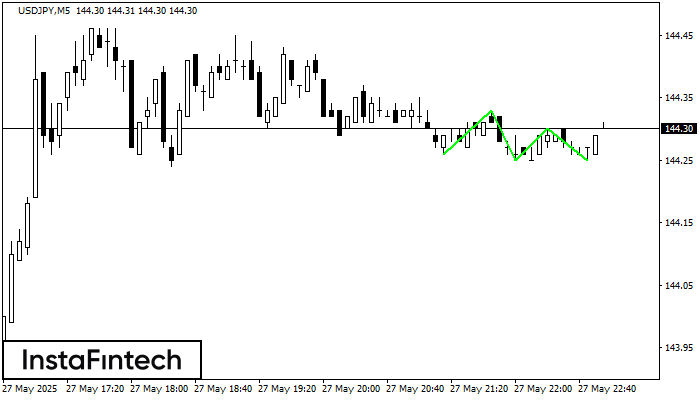
Pola Bawah Triple telah terbentuk pada grafik instrumen trading USDJPY M5. Pola tersebut menandakan perubahan dalam trend dari menurun menjadi naik jika terjadi pemecahan (breakdown) 144.33/144.30
Rangka waktu M5 dan M15 mungkin memiliki lebih dari titik entri yang keliru.
Open chart in a new window


