Double Top
was formed on 23.04 at 18:05:02 (UTC+0)
signal strength 1 of 5

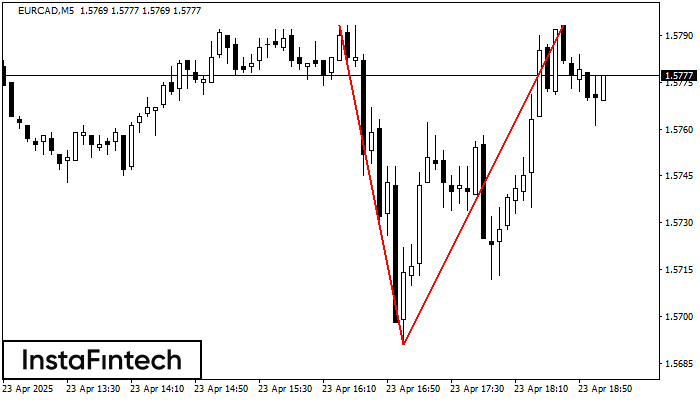
On the chart of EURCAD M5 the Double Top reversal pattern has been formed. Characteristics: the upper boundary 1.5793; the lower boundary 1.5691; the width of the pattern 102 points. The signal: a break of the lower boundary will cause continuation of the downward trend targeting the 1.5676 level.
The M5 and M15 time frames may have more false entry points.
- All
- All
- Bearish Rectangle
- Bearish Symmetrical Triangle
- Bullish Rectangle
- Double Top
- Double Top
- Triple Bottom
- Triple Bottom
- Triple Top
- Triple Top
- All
- All
- Buy
- Sale
- All
- 1
- 2
- 3
- 4
- 5
Persegi Bullish
was formed on 09.05 at 19:25:18 (UTC+0)
signal strength 1 of 5
Menurut grafik dari M5, EURJPY terbentuk Persegi Bullish. Pola menunjukkan kelanjutan tren. Batas atas adalah 163.61, batas lebih rendah adalah 163.49. Sinyal berarti posisi beli harus dibuka diatas batas atas
Rangka waktu M5 dan M15 mungkin memiliki lebih dari titik entri yang keliru.
Open chart in a new window
Bawah Ganda
was formed on 09.05 at 19:20:18 (UTC+0)
signal strength 1 of 5
Pola Bawah Ganda telah terbentuk pada #EBAY M5; batas atas di 69.84; batas bawah di 69.43. Lebar pola sebesar 42 poin. Jika harga menembus batas atas 69.84, Perubahan dalam tren
Rangka waktu M5 dan M15 mungkin memiliki lebih dari titik entri yang keliru.
Open chart in a new window
Bawah Ganda
was formed on 09.05 at 17:59:49 (UTC+0)
signal strength 1 of 5
Pola Bawah Ganda telah terbentuk pada #INTC M5; batas atas di 21.03; batas bawah di 20.90. Lebar pola sebesar 14 poin. Jika harga menembus batas atas 21.03, Perubahan dalam tren
Rangka waktu M5 dan M15 mungkin memiliki lebih dari titik entri yang keliru.
Open chart in a new window