

Pola sebenarnya

Triple Top
was formed on 23.04 at 15:44:43 (UTC+0)
signal strength 2 of 5
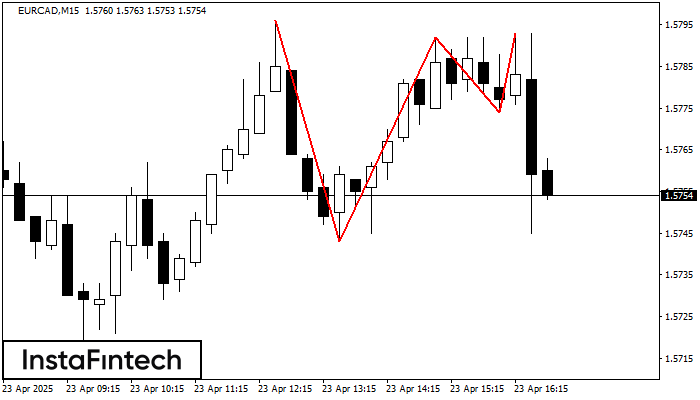
The Triple Top pattern has formed on the chart of the EURCAD M15. Features of the pattern: borders have an ascending angle; the lower line of the pattern has the coordinates 1.5743/1.5774 with the upper limit 1.5796/1.5793; the projection of the width is 53 points. The formation of the Triple Top figure most likely indicates a change in the trend from upward to downward. This means that in the event of a breakdown of the support level of 1.5743, the price is most likely to continue the downward movement.
The M5 and M15 time frames may have more false entry points.
- All
- All
- Bearish Rectangle
- Bearish Symmetrical Triangle
- Bearish Symmetrical Triangle
- Bullish Rectangle
- Double Top
- Double Top
- Triple Bottom
- Triple Bottom
- Triple Top
- Triple Top
- All
- All
- Buy
- Sale
- All
- 1
- 2
- 3
- 4
- 5
Двойное дно
сформирован 05.08 в 10:00:07 (UTC+0)
сила сигнала 4 из 5
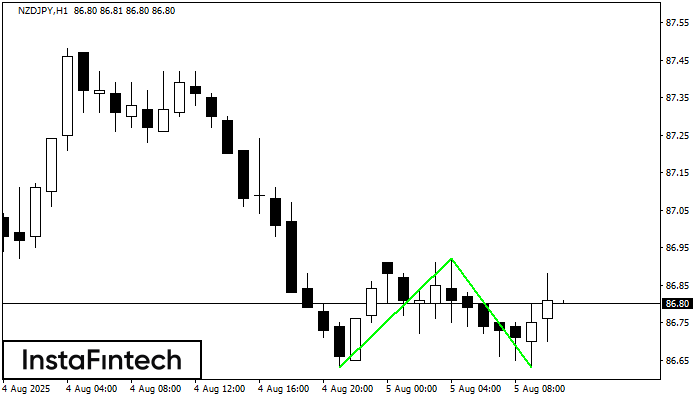
Сформирована фигура «Двойное дно» на графике NZDJPY H1. Данное формирование сигнализирует об изменении тенденции с нисходящего на восходящее движение. Сигнал: Торговую позицию на покупку следует открывать после пробоя верхней границы
Открыть график инструмента в новом окне
Тройное дно
сформирован 05.08 в 10:00:06 (UTC+0)
сила сигнала 4 из 5
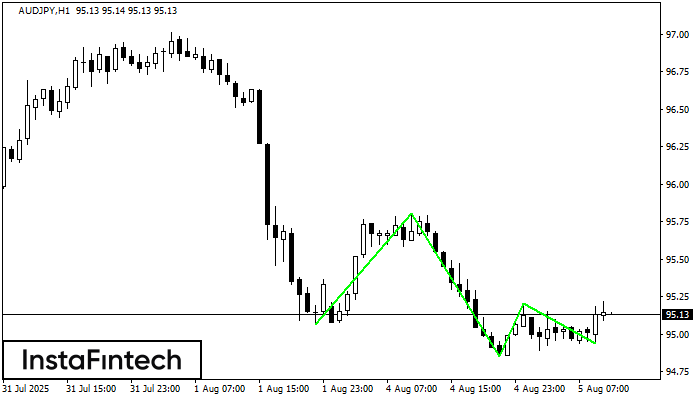
По торговому инструменту AUDJPY на H1 была сформирована графическая фигура «Тройное дно» с характеристиками: Уровень сопротивления 95.20; Уровень поддержки 94.94; Ширина 26 пунктов. В случае пробоя уровня сопротивления 95.80 котировка
Открыть график инструмента в новом окне
Двойное дно
сформирован 05.08 в 09:30:12 (UTC+0)
сила сигнала 3 из 5
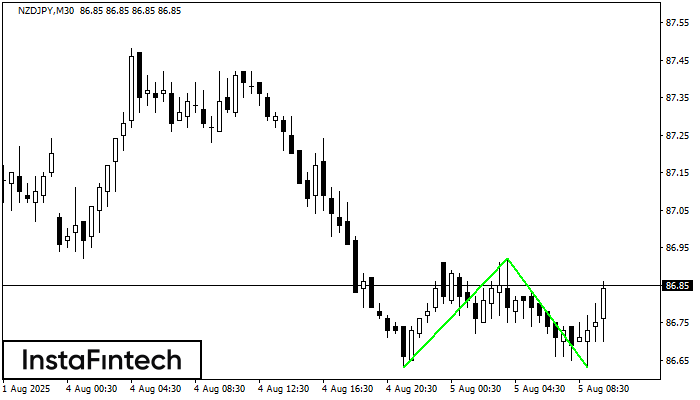
Сформирована фигура «Двойное дно» на графике NZDJPY M30. Характеристика: Уровень поддержки 86.63; Уровень сопротивления 86.92; Ширина фигуры 29 пунктов. В случае пробоя уровня сопротивления можно будет прогнозировать изменение тенденции
Открыть график инструмента в новом окне


