

Pola sebenarnya

Double Bottom
was formed on 23.04 at 14:09:50 (UTC+0)
signal strength 1 of 5
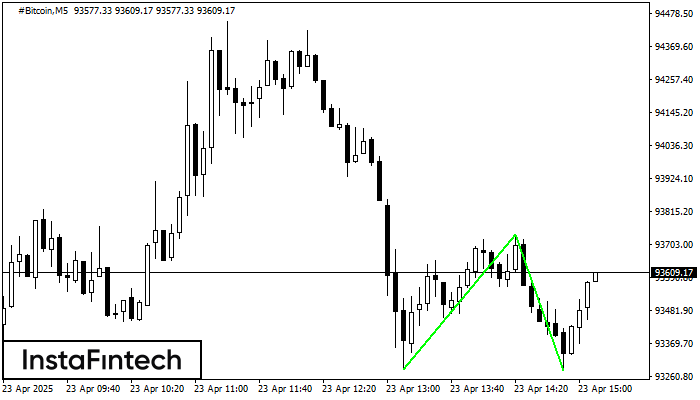
The Double Bottom pattern has been formed on #Bitcoin M5; the upper boundary is 93737.29; the lower boundary is 93280.25. The width of the pattern is 45284 points. In case of a break of the upper boundary 93737.29, a change in the trend can be predicted where the width of the pattern will coincide with the distance to a possible take profit level.
The M5 and M15 time frames may have more false entry points.
Lihat juga
- All
- All
- Bearish Rectangle
- Bearish Symmetrical Triangle
- Bearish Symmetrical Triangle
- Bullish Rectangle
- Double Top
- Double Top
- Triple Bottom
- Triple Bottom
- Triple Top
- Triple Top
- All
- All
- Buy
- Sale
- All
- 1
- 2
- 3
- 4
- 5
Bawah Ganda
was formed on 08.08 at 22:31:28 (UTC+0)
signal strength 1 of 5
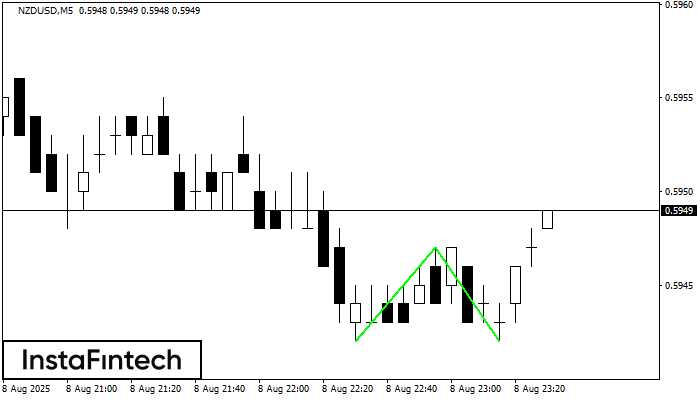
Pola Bawah Ganda telah terbentuk pada NZDUSD M5; batas atas di 0.5947; batas bawah di 0.5942. Lebar pola sebesar 5 poin. Jika harga menembus batas atas 0.5947, Perubahan dalam tren
Rangka waktu M5 dan M15 mungkin memiliki lebih dari titik entri yang keliru.
Open chart in a new window
Teratas Ganda
was formed on 08.08 at 21:30:13 (UTC+0)
signal strength 3 of 5
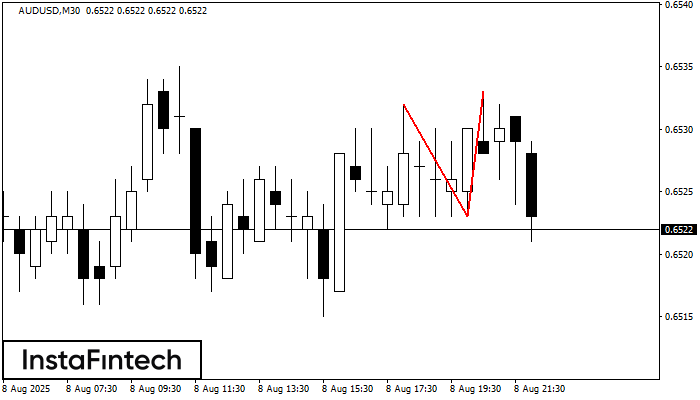
Pola Teratas Ganda telah terbentuk pada AUDUSD M30. Pola ini menandakan bahwa tren telah berubah dari kenaikan menjadi penurunan. Mungkin, jika dasar pola di 0.6523 ditembus, maka pergerakan menurun akan
Open chart in a new window
Panji Bullish
was formed on 08.08 at 21:12:19 (UTC+0)
signal strength 3 of 5
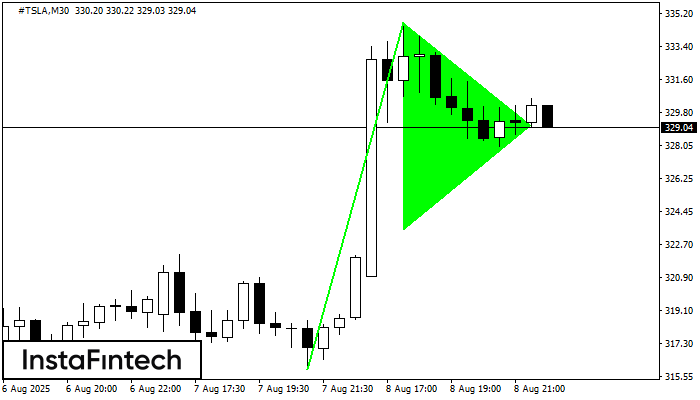
Pola Panji Bullish terbentuk di grafik #TSLA M30. Ini adalah jenis pola kelanjutan. Diduga, jika harga ditetapkan di atas titik tertinggi panji di 334.72, tren naik selanjutnya mungkin terjadi
Open chart in a new window


