

Pola sebenarnya

Inverse Head and Shoulder
was formed on 23.04 at 06:25:20 (UTC+0)
signal strength 1 of 5
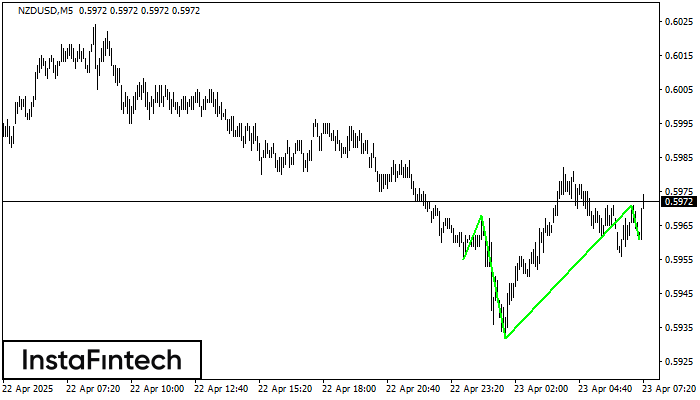
According to M5, NZDUSD is shaping the technical pattern – the Inverse Head and Shoulder. In case the Neckline 0.5968/0.5971 is broken out, the instrument is likely to move toward 0.5986.
The M5 and M15 time frames may have more false entry points.
- All
- All
- Bearish Rectangle
- Bearish Symmetrical Triangle
- Bearish Symmetrical Triangle
- Bullish Rectangle
- Double Top
- Double Top
- Triple Bottom
- Triple Bottom
- Triple Top
- Triple Top
- All
- All
- Buy
- Sale
- All
- 1
- 2
- 3
- 4
- 5
Double Bottom
was formed on 02.06 at 00:05:19 (UTC+0)
signal strength 1 of 5
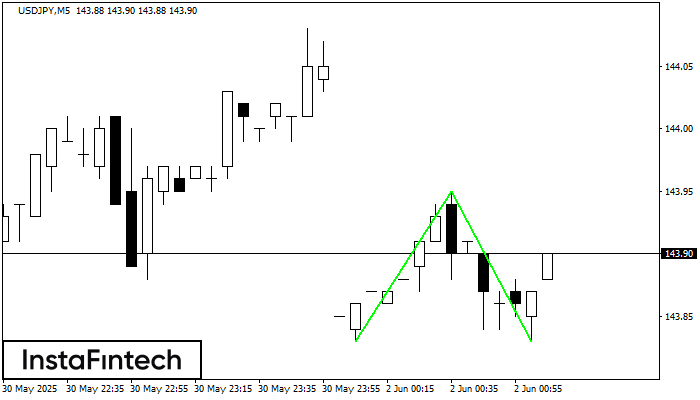
The Double Bottom pattern has been formed on USDJPY M5. This formation signals a reversal of the trend from downwards to upwards. The signal is that a buy trade should
The M5 and M15 time frames may have more false entry points.
Open chart in a new window
Double Bottom
was formed on 01.06 at 23:00:15 (UTC+0)
signal strength 1 of 5
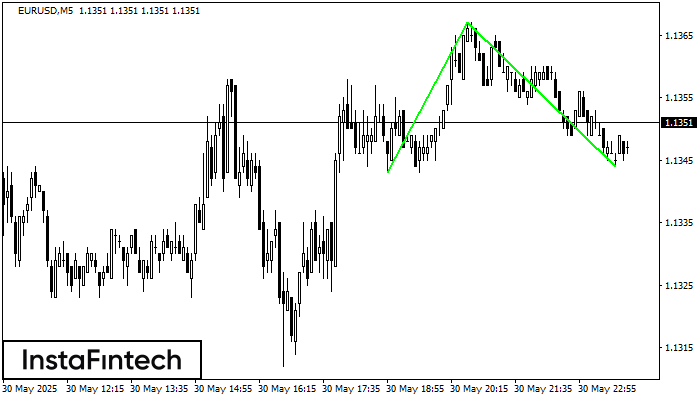
The Double Bottom pattern has been formed on EURUSD M5. Characteristics: the support level 1.1343; the resistance level 1.1367; the width of the pattern 24 points. If the resistance level
The M5 and M15 time frames may have more false entry points.
Open chart in a new window
Double Top
was formed on 01.06 at 23:00:15 (UTC+0)
signal strength 2 of 5
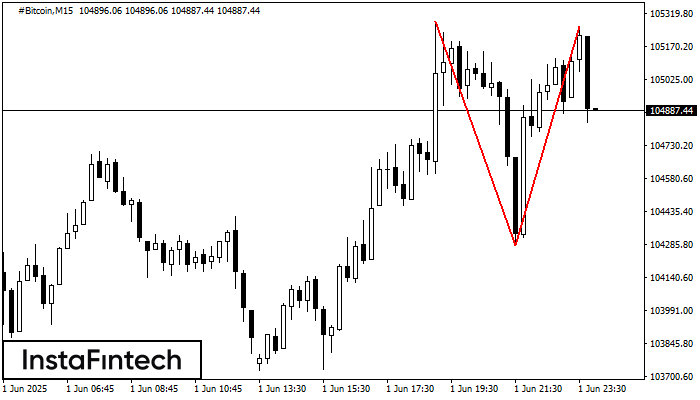
On the chart of #Bitcoin M15 the Double Top reversal pattern has been formed. Characteristics: the upper boundary 105260.12; the lower boundary 104281.85; the width of the pattern 97827 points
The M5 and M15 time frames may have more false entry points.
Open chart in a new window


