

Pola sebenarnya

Double Bottom
was formed on 23.04 at 05:25:25 (UTC+0)
signal strength 1 of 5
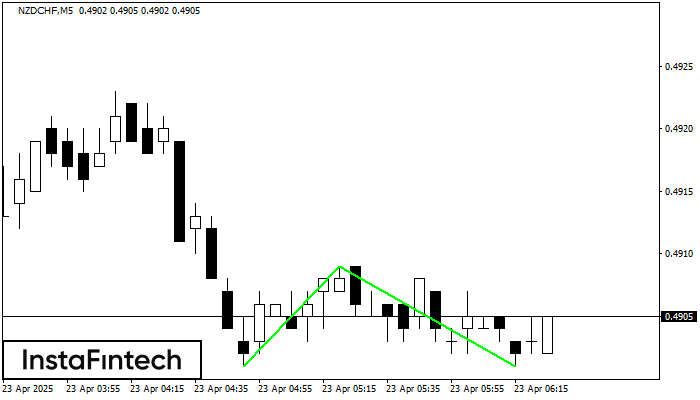
The Double Bottom pattern has been formed on NZDCHF M5. This formation signals a reversal of the trend from downwards to upwards. The signal is that a buy trade should be opened after the upper boundary of the pattern 0.4909 is broken. The further movements will rely on the width of the current pattern 8 points.
The M5 and M15 time frames may have more false entry points.
Lihat juga
- All
- All
- Bearish Rectangle
- Bearish Symmetrical Triangle
- Bearish Symmetrical Triangle
- Bullish Rectangle
- Double Top
- Double Top
- Triple Bottom
- Triple Bottom
- Triple Top
- Triple Top
- All
- All
- Buy
- Sale
- All
- 1
- 2
- 3
- 4
- 5
Teratas Triple
was formed on 01.06 at 02:15:04 (UTC+0)
signal strength 2 of 5

Pada grafik instrumen trading #Bitcoin M15, pola Teratas Triple yang menandakan perubahan trend telah terbentuk. Ada kemungkinan bahwa setelah pembentukan puncak (peak) ketiga, harga akan mencoba untuk menembus level resistance
Rangka waktu M5 dan M15 mungkin memiliki lebih dari titik entri yang keliru.
Open chart in a new window
Teratas Ganda
was formed on 01.06 at 01:00:35 (UTC+0)
signal strength 3 of 5

Pola reversal Teratas Ganda telah terbentuk pada #Bitcoin M30. Karakteristik: batas atas 104800.13; batas bawah 104215.56; lebar pola 64024 poin. Transaksi jual lebih baik dibuka di bawah batas bawah 104215.56
Open chart in a new window
Persegi Bullish
was formed on 31.05 at 19:15:46 (UTC+0)
signal strength 1 of 5

Menurut grafik dari M5, #Bitcoin terbentuk Persegi Bullish yang merupakan pola dari kelanjutan tren. Pola terkandung dalam batas berikut: batas yang lebih rendah 104335.43 – 104335.43 dan batas atas 104800.13
Rangka waktu M5 dan M15 mungkin memiliki lebih dari titik entri yang keliru.
Open chart in a new window


