

Pola sebenarnya

Triple Top
was formed on 22.04 at 21:55:10 (UTC+0)
signal strength 1 of 5
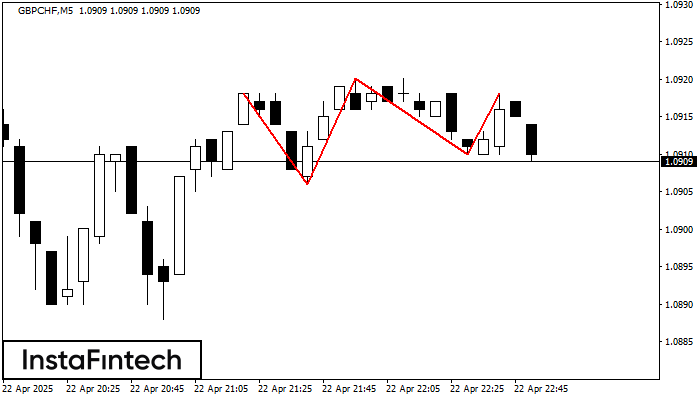
The Triple Top pattern has formed on the chart of the GBPCHF M5. Features of the pattern: borders have an ascending angle; the lower line of the pattern has the coordinates 1.0906/1.0910 with the upper limit 1.0918/1.0918; the projection of the width is 12 points. The formation of the Triple Top figure most likely indicates a change in the trend from upward to downward. This means that in the event of a breakdown of the support level of 1.0906, the price is most likely to continue the downward movement.
The M5 and M15 time frames may have more false entry points.
Lihat juga
- All
- All
- Bearish Rectangle
- Bearish Symmetrical Triangle
- Bearish Symmetrical Triangle
- Bullish Rectangle
- Double Top
- Double Top
- Triple Bottom
- Triple Bottom
- Triple Top
- Triple Top
- All
- All
- Buy
- Sale
- All
- 1
- 2
- 3
- 4
- 5
Double Top
was formed on 06.06 at 05:05:28 (UTC+0)
signal strength 1 of 5
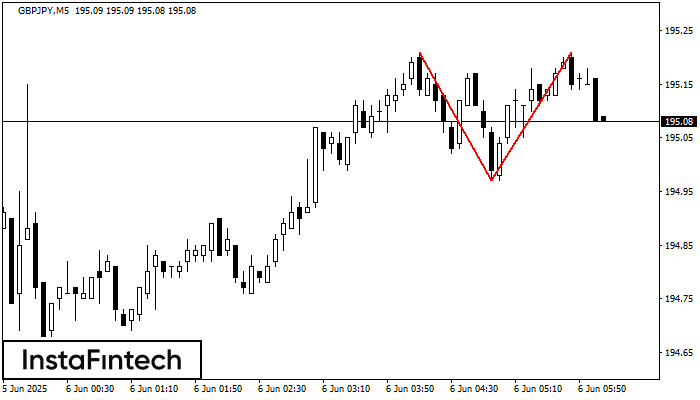
The Double Top reversal pattern has been formed on GBPJPY M5. Characteristics: the upper boundary 195.21; the lower boundary 194.97; the width of the pattern is 24 points. Sell trades
The M5 and M15 time frames may have more false entry points.
Open chart in a new window
Head and Shoulders
was formed on 06.06 at 05:01:27 (UTC+0)
signal strength 4 of 5
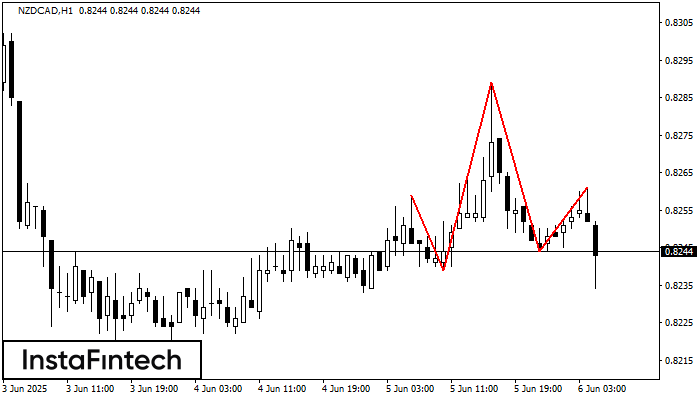
The technical pattern called Head and Shoulders has appeared on the chart of NZDCAD H1. There are weighty reasons to suggest that the price will surpass the Neckline 0.8239/0.8244 after
Open chart in a new window
Inverse Head and Shoulder
was formed on 06.06 at 05:00:19 (UTC+0)
signal strength 4 of 5
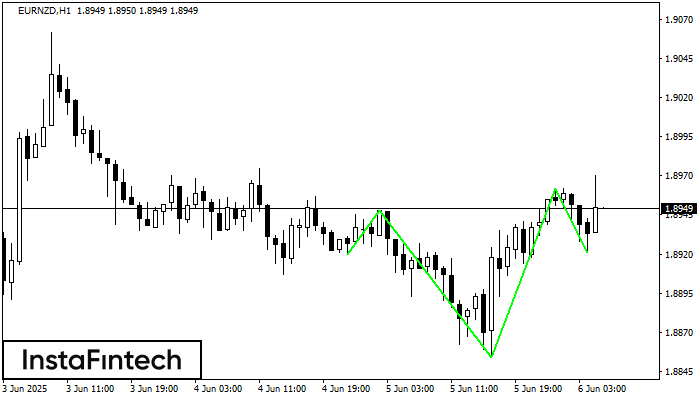
According to H1, EURNZD is shaping the technical pattern – the Inverse Head and Shoulder. In case the Neckline 1.8948/1.8962 is broken out, the instrument is likely to move toward
Open chart in a new window


