

Pola sebenarnya

Double Bottom
was formed on 22.04 at 19:15:32 (UTC+0)
signal strength 1 of 5
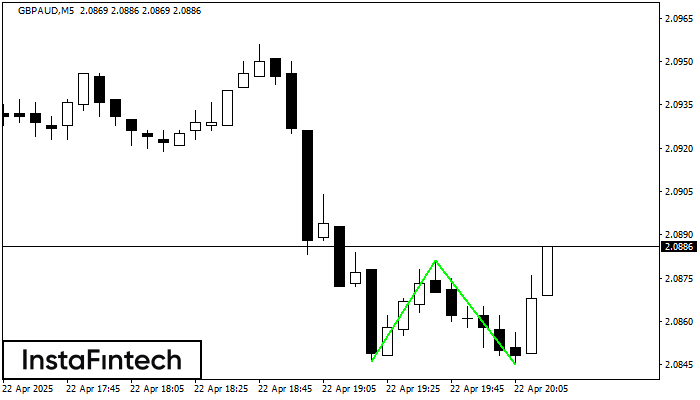
The Double Bottom pattern has been formed on GBPAUD M5; the upper boundary is 2.0881; the lower boundary is 2.0845. The width of the pattern is 35 points. In case of a break of the upper boundary 2.0881, a change in the trend can be predicted where the width of the pattern will coincide with the distance to a possible take profit level.
The M5 and M15 time frames may have more false entry points.
Lihat juga
- All
- All
- Bearish Rectangle
- Bearish Symmetrical Triangle
- Bearish Symmetrical Triangle
- Bullish Rectangle
- Double Top
- Double Top
- Triple Bottom
- Triple Bottom
- Triple Top
- Triple Top
- All
- All
- Buy
- Sale
- All
- 1
- 2
- 3
- 4
- 5
Bawah Ganda
was formed on 23.05 at 16:44:58 (UTC+0)
signal strength 1 of 5
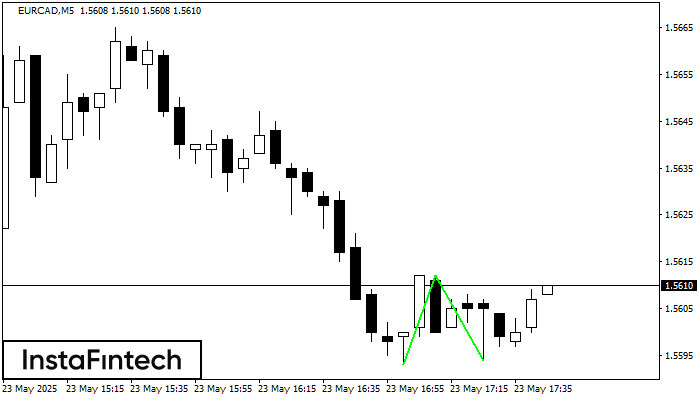
Pola Bawah Ganda telah terbentuk pada EURCAD M5; batas atas di 1.5612; batas bawah di 1.5594. Lebar pola sebesar 19 poin. Jika harga menembus batas atas 1.5612, Perubahan dalam tren
Rangka waktu M5 dan M15 mungkin memiliki lebih dari titik entri yang keliru.
Open chart in a new window
Panji Bearish
was formed on 23.05 at 15:46:06 (UTC+0)
signal strength 1 of 5
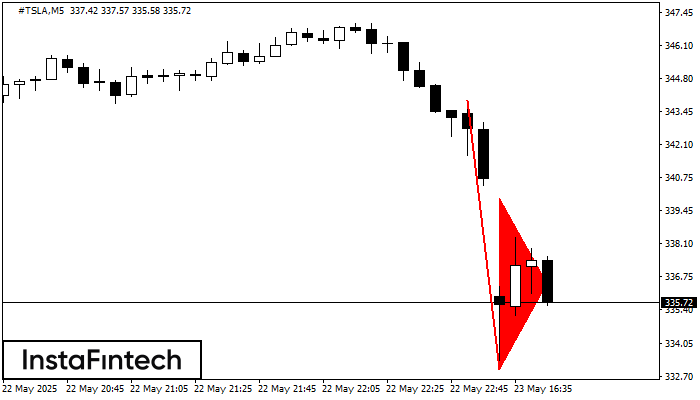
Pola Panji Bearish telah terbentuk di grafik #TSLA M5. Pola ini memberikan sinyal potensi kelanjutan tren yang ada. Spesifikasi: titik terendah pola berkoordinat di 332.99; proyeksi titik tertinggi sama dengan
Rangka waktu M5 dan M15 mungkin memiliki lebih dari titik entri yang keliru.
Open chart in a new window
Panji Bearish
was formed on 23.05 at 15:45:52 (UTC+0)
signal strength 1 of 5

Pola Panji Bearish telah terbentuk di grafik Panji Bearish. Pola ini memberikan sinyal kelanjutan tren menurun jika titik terendah panji, di 332.99 ditembus. Rekomendasi: Tempatkan sell stop pending order
Rangka waktu M5 dan M15 mungkin memiliki lebih dari titik entri yang keliru.
Open chart in a new window


