

Pola sebenarnya

Head and Shoulders
was formed on 22.04 at 08:55:22 (UTC+0)
signal strength 1 of 5

The technical pattern called Head and Shoulders has appeared on the chart of GOLD M5. There are weighty reasons to suggest that the price will surpass the Neckline 3473.12/3476.36 after the right shoulder has been formed. So, the trend is set to change with the price heading for 3476.21.
The M5 and M15 time frames may have more false entry points.
- All
- All
- Bearish Rectangle
- Bearish Symmetrical Triangle
- Bearish Symmetrical Triangle
- Bullish Rectangle
- Double Top
- Double Top
- Triple Bottom
- Triple Bottom
- Triple Top
- Triple Top
- All
- All
- Buy
- Sale
- All
- 1
- 2
- 3
- 4
- 5
Teratas Ganda
was formed on 03.06 at 01:35:08 (UTC+0)
signal strength 1 of 5
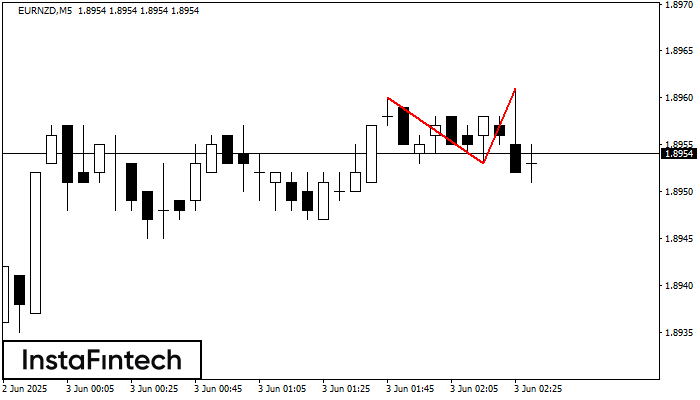
Pada grafik EURNZD M5 pola reversal Teratas Ganda telah terbentuk. Karakteristik: batas atas 1.8961; batas bawah 1.8953; lebar pola 8 poin. Sinyal: tembusan ke batas bawah akan menyebabkan kelanjutan tren
Rangka waktu M5 dan M15 mungkin memiliki lebih dari titik entri yang keliru.
Open chart in a new window
Teratas Triple
was formed on 03.06 at 00:30:20 (UTC+0)
signal strength 3 of 5
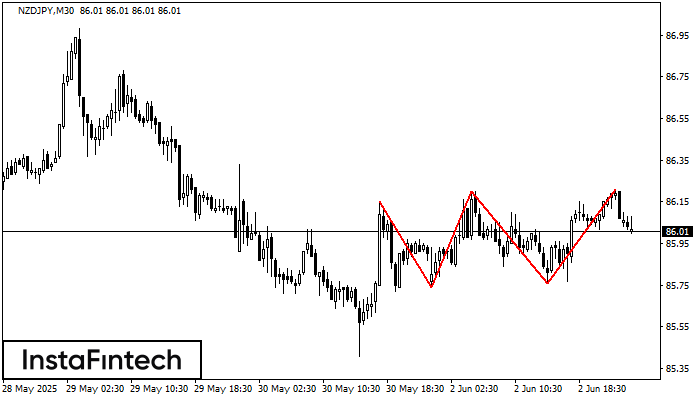
Pola Teratas Triple telah terbentuk pada grafik NZDJPY M30. Fitur-fitur pola: perbatasan memiliki sudut yang naik; batas bawah pola memiliki koordinat 85.74/85.76 dengan batas atas 86.15/86.21; proyeksi lebar adalah
Open chart in a new window
Bawah Triple
was formed on 03.06 at 00:05:20 (UTC+0)
signal strength 1 of 5

Pola Bawah Triple telah terbentuk pada grafik USDJPY M5. Fitur-fitur pola: garis bawah pola memiliki koordinat 142.75 dengan batas atas 142.75/142.69, proyeksi lebar adalah 7 poin. Pembentukan pola Bawah Triple
Rangka waktu M5 dan M15 mungkin memiliki lebih dari titik entri yang keliru.
Open chart in a new window


