

Pola sebenarnya

Bearish Symmetrical Triangle
was formed on 16.04 at 07:24:04 (UTC+0)
signal strength 1 of 5

According to the chart of M5, #Bitcoin formed the Bearish Symmetrical Triangle pattern. This pattern signals a further downward trend in case the lower border 83067.39 is breached. Here, a hypothetical profit will equal the width of the available pattern that is -98015 pips.
The M5 and M15 time frames may have more false entry points.
Lihat juga
- All
- All
- Bearish Rectangle
- Bearish Symmetrical Triangle
- Bearish Symmetrical Triangle
- Bullish Rectangle
- Double Top
- Double Top
- Triple Bottom
- Triple Bottom
- Triple Top
- Triple Top
- All
- All
- Buy
- Sale
- All
- 1
- 2
- 3
- 4
- 5
Double Bottom
was formed on 30.05 at 12:31:28 (UTC+0)
signal strength 3 of 5
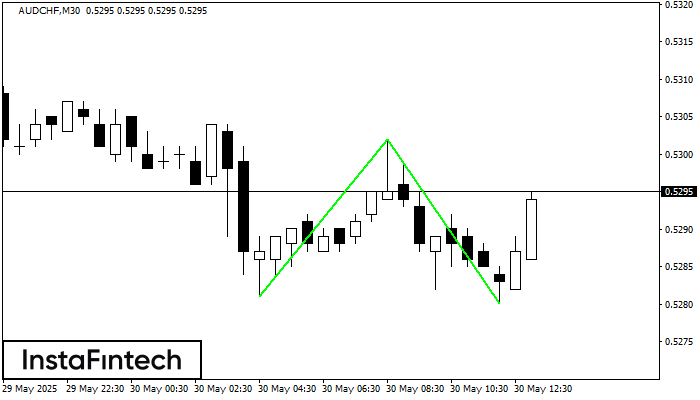
The Double Bottom pattern has been formed on AUDCHF M30. Characteristics: the support level 0.5281; the resistance level 0.5302; the width of the pattern 21 points. If the resistance level
Open chart in a new window
Double Bottom
was formed on 30.05 at 12:00:29 (UTC+0)
signal strength 2 of 5
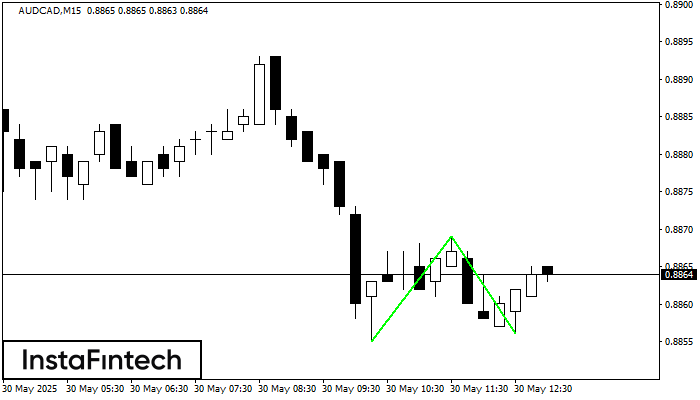
The Double Bottom pattern has been formed on AUDCAD M15; the upper boundary is 0.8869; the lower boundary is 0.8856. The width of the pattern is 14 points. In case
The M5 and M15 time frames may have more false entry points.
Open chart in a new window
Triple Bottom
was formed on 30.05 at 11:36:39 (UTC+0)
signal strength 1 of 5
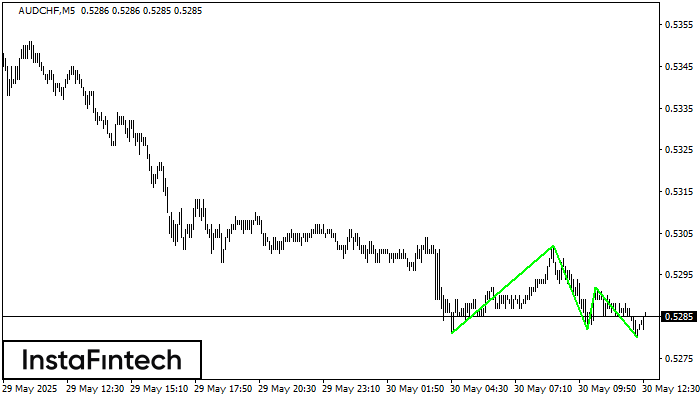
The Triple Bottom pattern has formed on the chart of AUDCHF M5. Features of the pattern: The lower line of the pattern has coordinates 0.5302 with the upper limit 0.5302/0.5292
The M5 and M15 time frames may have more false entry points.
Open chart in a new window


