

Pola sebenarnya

Double Bottom
was formed on 16.04 at 05:05:29 (UTC+0)
signal strength 1 of 5
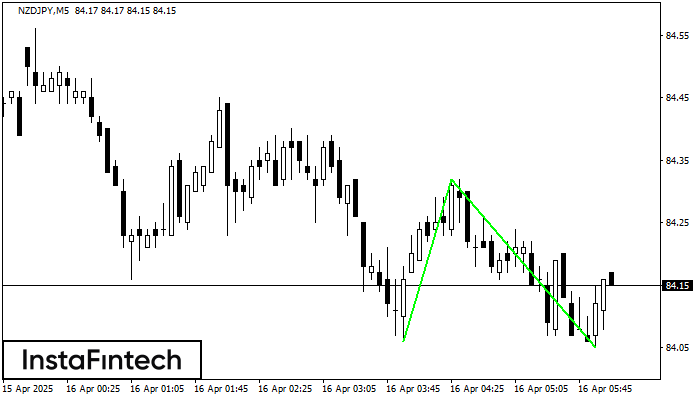
The Double Bottom pattern has been formed on NZDJPY M5. This formation signals a reversal of the trend from downwards to upwards. The signal is that a buy trade should be opened after the upper boundary of the pattern 84.32 is broken. The further movements will rely on the width of the current pattern 26 points.
The M5 and M15 time frames may have more false entry points.
- All
- All
- Bearish Rectangle
- Bearish Symmetrical Triangle
- Bearish Symmetrical Triangle
- Bullish Rectangle
- Double Top
- Double Top
- Triple Bottom
- Triple Bottom
- Triple Top
- Triple Top
- All
- All
- Buy
- Sale
- All
- 1
- 2
- 3
- 4
- 5
Teratas Ganda
was formed on 06.06 at 22:30:10 (UTC+0)
signal strength 2 of 5

Pada grafik USDCAD M15 pola reversal Teratas Ganda telah terbentuk. Karakteristik: batas atas 1.3702; batas bawah 1.3668; lebar pola 34 poin. Sinyal: tembusan ke batas bawah akan menyebabkan kelanjutan tren
Rangka waktu M5 dan M15 mungkin memiliki lebih dari titik entri yang keliru.
Open chart in a new window
Segitiga Simetris Bullish
was formed on 06.06 at 22:18:11 (UTC+0)
signal strength 2 of 5

Menurut Grafik dari M15, AUDJPY dibentuk pola Segitiga Simetris Bullish. Batas yang lebih rendah dari pola menyentuh kordinat 93.96/94.02 dimana batas atas berada sepanjang 94.07/94.02. Jika pola Segitiga Simetris Bullish
Rangka waktu M5 dan M15 mungkin memiliki lebih dari titik entri yang keliru.
Open chart in a new window
Bawah Triple
was formed on 06.06 at 22:01:08 (UTC+0)
signal strength 3 of 5

Pola Bawah Triple telah terbentuk pada grafik instrumen trading GBPAUD M30. Pola tersebut menandakan perubahan dalam trend dari menurun menjadi naik jika terjadi pemecahan (breakdown) 2.0879/2.0852
Open chart in a new window

