

Pola sebenarnya

Double Bottom
was formed on 15.04 at 14:40:16 (UTC+0)
signal strength 1 of 5
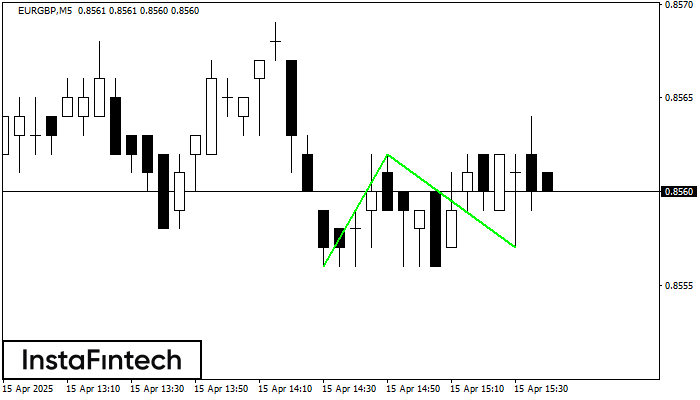
The Double Bottom pattern has been formed on EURGBP M5. This formation signals a reversal of the trend from downwards to upwards. The signal is that a buy trade should be opened after the upper boundary of the pattern 0.8562 is broken. The further movements will rely on the width of the current pattern 6 points.
The M5 and M15 time frames may have more false entry points.
Lihat juga
- All
- All
- Bearish Rectangle
- Bearish Symmetrical Triangle
- Bearish Symmetrical Triangle
- Bullish Rectangle
- Double Top
- Double Top
- Triple Bottom
- Triple Bottom
- Triple Top
- Triple Top
- All
- All
- Buy
- Sale
- All
- 1
- 2
- 3
- 4
- 5
Segitiga Simetris Bearish
was formed on 11.08 at 06:26:01 (UTC+0)
signal strength 1 of 5
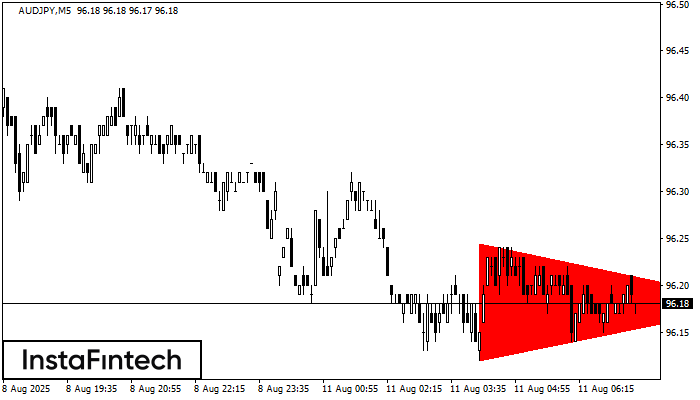
Menurut Grafik dari M5, AUDJPY dibentuk pola Segitiga Simetris Bearish. Deskripsi: Batas yang lebih rendah adalah 96.12/96.18 dan batas atas adalah 96.24/96.18. Lebar pola diukur dalam grafik di -12 pips
Rangka waktu M5 dan M15 mungkin memiliki lebih dari titik entri yang keliru.
Open chart in a new window
Persegi Bullish
was formed on 11.08 at 04:01:16 (UTC+0)
signal strength 3 of 5
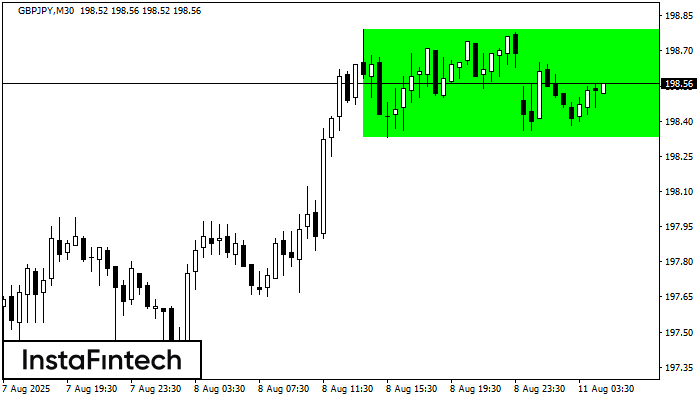
Menurut grafik dari M30, GBPJPY terbentuk Persegi Bullish. Pola menunjukkan kelanjutan tren. Batas atas adalah 198.79, batas lebih rendah adalah 198.33. Sinyal berarti posisi beli harus dibuka diatas batas atas
Open chart in a new window
Bawah Ganda
was formed on 11.08 at 03:00:24 (UTC+0)
signal strength 1 of 5
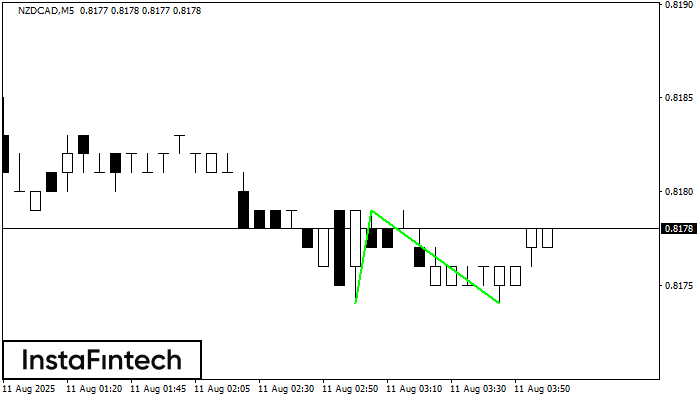
Pola Bawah Ganda telah terbentuk pada NZDCAD M5. Formasi ini mensinyalkan reversal tren dari arah penurunan ke arah kenaikan. Sinyal menunjukkan bahwa transaksi beli harus dibuka setelah batas atas pola
Rangka waktu M5 dan M15 mungkin memiliki lebih dari titik entri yang keliru.
Open chart in a new window


