

Pola sebenarnya

Double Bottom
was formed on 15.04 at 14:04:52 (UTC+0)
signal strength 1 of 5
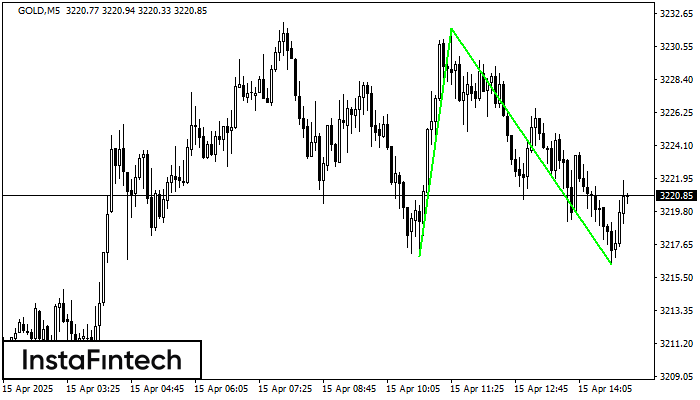
The Double Bottom pattern has been formed on GOLD M5. This formation signals a reversal of the trend from downwards to upwards. The signal is that a buy trade should be opened after the upper boundary of the pattern 3231.69 is broken. The further movements will rely on the width of the current pattern 1483 points.
The M5 and M15 time frames may have more false entry points.
- All
- All
- Bearish Rectangle
- Bearish Symmetrical Triangle
- Bearish Symmetrical Triangle
- Bullish Rectangle
- Double Top
- Double Top
- Triple Bottom
- Triple Bottom
- Triple Top
- Triple Top
- All
- All
- Buy
- Sale
- All
- 1
- 2
- 3
- 4
- 5
Double Bottom
was formed on 02.06 at 09:00:13 (UTC+0)
signal strength 3 of 5

Corak Double Bottom telah dibentuk pada GBPJPY M30. Ciri-ciri: tahap sokongan 193.37; tahap rintangan 194.63; lebar corak 126 mata. Sekiranya tahap rintangan ditembusi, perubahan aliran boleh diramalkan dengan titik sasaran
Open chart in a new window
Double Bottom
was formed on 02.06 at 09:00:05 (UTC+0)
signal strength 4 of 5
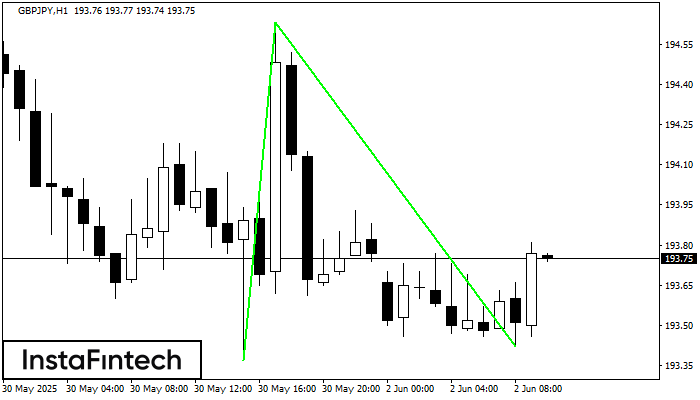
Corak Double Bottom telah dibentuk pada GBPJPY H1. Pembentukan ini menandakan pembalikan aliran dari aliran menurun ke atas. Isyarat ialah perdagangan membeli harus dibuka selepas sempadan atas corak 194.63 telah
Open chart in a new window
Double Bottom
was formed on 02.06 at 08:44:59 (UTC+0)
signal strength 2 of 5
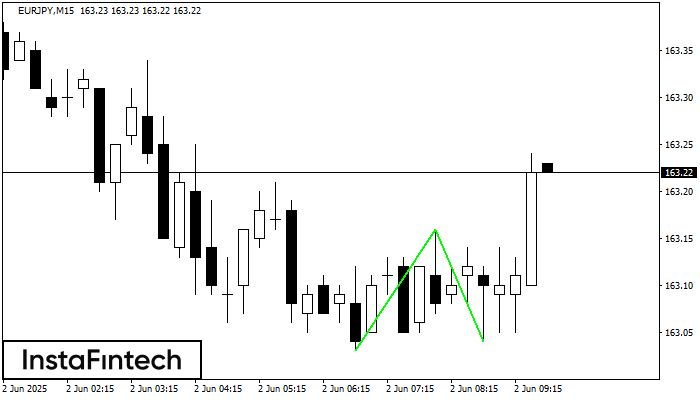
Corak Double Bottom telah dibentuk pada EURJPY M15; sempadan atas adalah 163.16; sempadan bawah adalah 163.04. Lebar corak adalah 13 mata. Sekiranya penembusan sempadan atas 163.16, perubahan aliran boleh diramalkan
Carta masa M5 dan M15 mungkin mempunyai lebih banyak titik kemasukan palsu.
Open chart in a new window


