

Pola sebenarnya

Triple Bottom
was formed on 15.04 at 12:09:53 (UTC+0)
signal strength 1 of 5
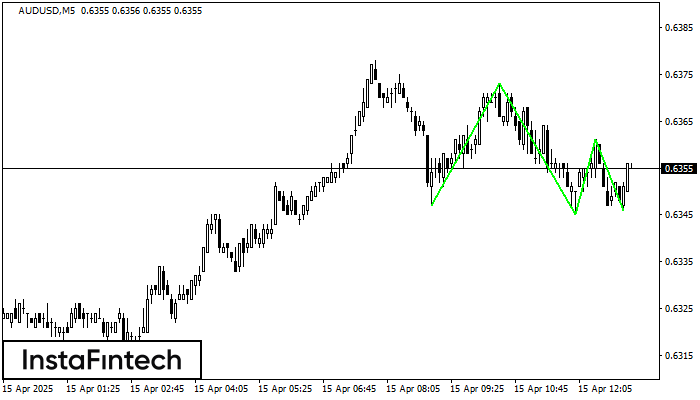
The Triple Bottom pattern has been formed on AUDUSD M5. It has the following characteristics: resistance level 0.6373/0.6361; support level 0.6347/0.6346; the width is 26 points. In the event of a breakdown of the resistance level of 0.6373, the price is likely to continue an upward movement at least to 0.6360.
The M5 and M15 time frames may have more false entry points.
Lihat juga
- All
- All
- Bearish Rectangle
- Bearish Symmetrical Triangle
- Bearish Symmetrical Triangle
- Bullish Rectangle
- Double Top
- Double Top
- Triple Bottom
- Triple Bottom
- Triple Top
- Triple Top
- All
- All
- Buy
- Sale
- All
- 1
- 2
- 3
- 4
- 5
Bearish Symmetrical Triangle
was formed on 30.05 at 00:39:15 (UTC+0)
signal strength 3 of 5
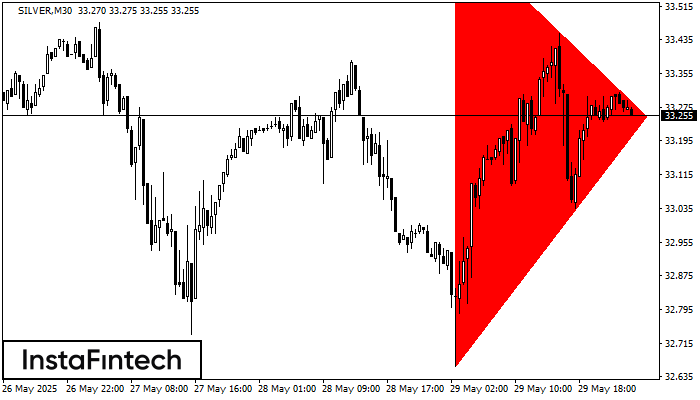
According to the chart of M30, SILVER formed the Bearish Symmetrical Triangle pattern. Trading recommendations: A breach of the lower border 32.66 is likely to encourage a continuation
Open chart in a new window
Bearish Symmetrical Triangle
was formed on 26.05 at 07:35:04 (UTC+0)
signal strength 3 of 5
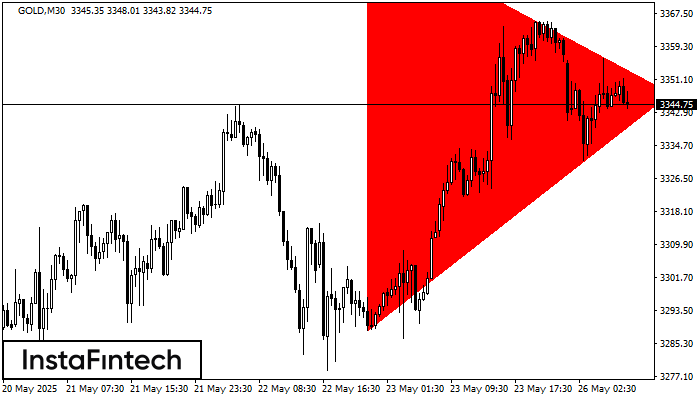
According to the chart of M30, GOLD formed the Bearish Symmetrical Triangle pattern. Description: The lower border is 3288.62/3347.68 and upper border is 3388.17/3347.68. The pattern width is measured
Open chart in a new window
Bearish Symmetrical Triangle
was formed on 23.05 at 08:32:20 (UTC+0)
signal strength 3 of 5
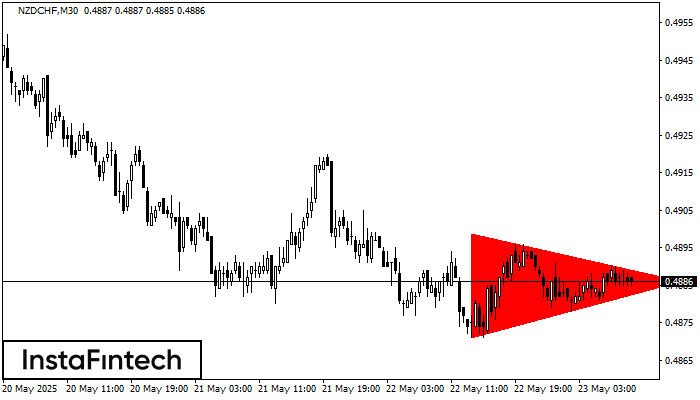
According to the chart of M30, NZDCHF formed the Bearish Symmetrical Triangle pattern. Description: The lower border is 0.4871/0.4886 and upper border is 0.4899/0.4886. The pattern width is measured
Open chart in a new window


