

Pola sebenarnya

Bearish Rectangle
was formed on 15.04 at 12:03:16 (UTC+0)
signal strength 1 of 5
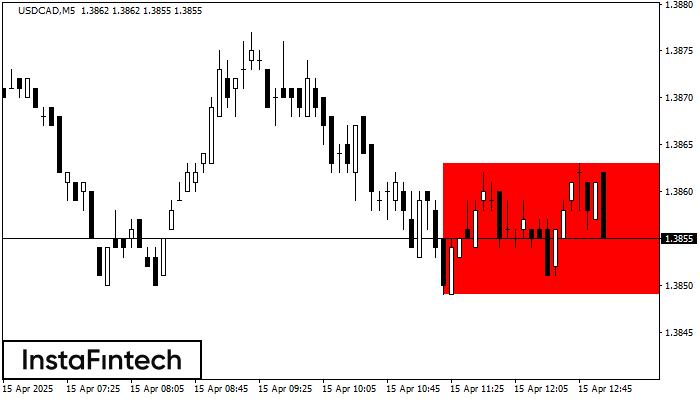
According to the chart of M5, USDCAD formed the Bearish Rectangle. The pattern indicates a trend continuation. The upper border is 1.3863, the lower border is 1.3849. The signal means that a short position should be opened after fixing a price below the lower border 1.3849 of the Bearish Rectangle.
The M5 and M15 time frames may have more false entry points.
- All
- All
- Bearish Rectangle
- Bearish Symmetrical Triangle
- Bearish Symmetrical Triangle
- Bullish Rectangle
- Double Top
- Double Top
- Triple Bottom
- Triple Bottom
- Triple Top
- Triple Top
- All
- All
- Buy
- Sale
- All
- 1
- 2
- 3
- 4
- 5
Double Bottom
was formed on 31.05 at 13:20:01 (UTC+0)
signal strength 1 of 5

The Double Bottom pattern has been formed on #Bitcoin M5. Characteristics: the support level 103250.25; the resistance level 103385.09; the width of the pattern 13484 points. If the resistance level
The M5 and M15 time frames may have more false entry points.
Open chart in a new window
Triple Top
was formed on 30.05 at 22:20:23 (UTC+0)
signal strength 1 of 5

The Triple Top pattern has formed on the chart of the GOLD M5 trading instrument. It is a reversal pattern featuring the following characteristics: resistance level 4, support level -193
The M5 and M15 time frames may have more false entry points.
Open chart in a new window
Inverse Head and Shoulder
was formed on 30.05 at 21:50:24 (UTC+0)
signal strength 1 of 5

According to the chart of M5, #AMZN produced the pattern termed the Inverse Head and Shoulder. The Head is fixed at 201.64 while the median line of the Neck
The M5 and M15 time frames may have more false entry points.
Open chart in a new window


