

Pola sebenarnya

Bullish Rectangle
was formed on 15.04 at 08:45:45 (UTC+0)
signal strength 1 of 5
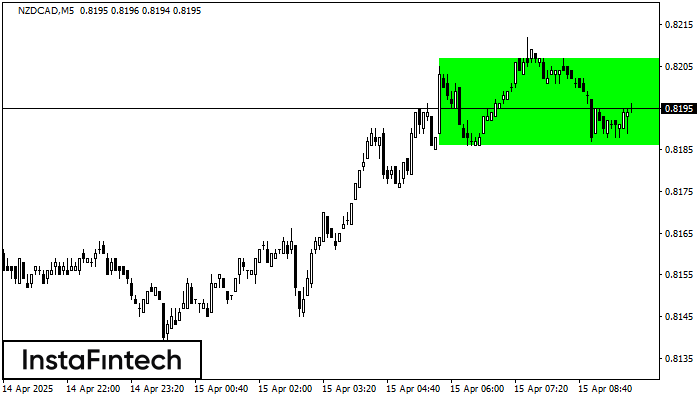
According to the chart of M5, NZDCAD formed the Bullish Rectangle. The pattern indicates a trend continuation. The upper border is 0.8207, the lower border is 0.8186. The signal means that a long position should be opened above the upper border 0.8207 of the Bullish Rectangle.
The M5 and M15 time frames may have more false entry points.
- All
- All
- Bearish Rectangle
- Bearish Symmetrical Triangle
- Bearish Symmetrical Triangle
- Bullish Rectangle
- Double Top
- Double Top
- Triple Bottom
- Triple Bottom
- Triple Top
- Triple Top
- All
- All
- Buy
- Sale
- All
- 1
- 2
- 3
- 4
- 5
Teratas Ganda
was formed on 03.06 at 01:35:08 (UTC+0)
signal strength 1 of 5
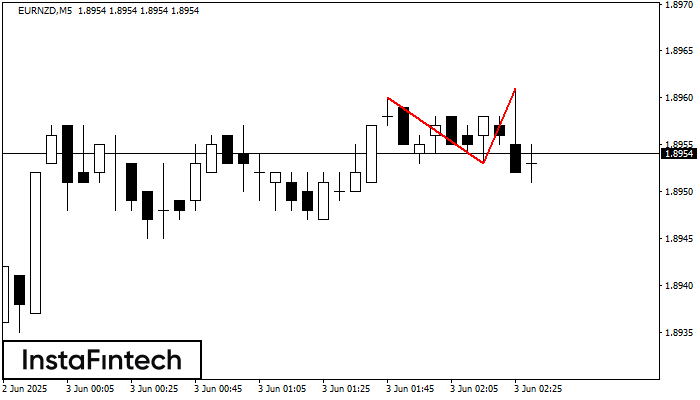
Pada grafik EURNZD M5 pola reversal Teratas Ganda telah terbentuk. Karakteristik: batas atas 1.8961; batas bawah 1.8953; lebar pola 8 poin. Sinyal: tembusan ke batas bawah akan menyebabkan kelanjutan tren
Rangka waktu M5 dan M15 mungkin memiliki lebih dari titik entri yang keliru.
Open chart in a new window
Teratas Triple
was formed on 03.06 at 00:30:20 (UTC+0)
signal strength 3 of 5
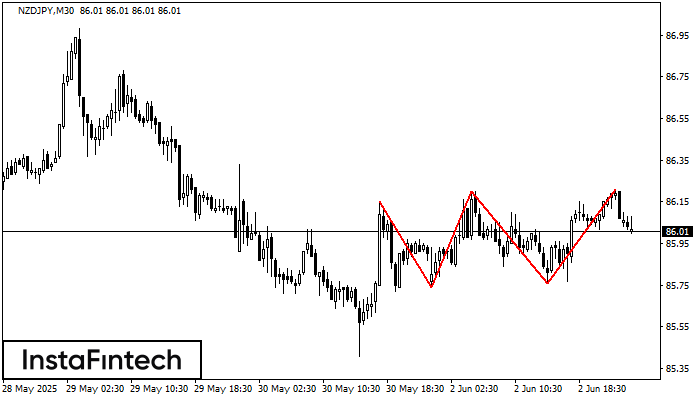
Pola Teratas Triple telah terbentuk pada grafik NZDJPY M30. Fitur-fitur pola: perbatasan memiliki sudut yang naik; batas bawah pola memiliki koordinat 85.74/85.76 dengan batas atas 86.15/86.21; proyeksi lebar adalah
Open chart in a new window
Bawah Triple
was formed on 03.06 at 00:05:20 (UTC+0)
signal strength 1 of 5

Pola Bawah Triple telah terbentuk pada grafik USDJPY M5. Fitur-fitur pola: garis bawah pola memiliki koordinat 142.75 dengan batas atas 142.75/142.69, proyeksi lebar adalah 7 poin. Pembentukan pola Bawah Triple
Rangka waktu M5 dan M15 mungkin memiliki lebih dari titik entri yang keliru.
Open chart in a new window


