

Pola sebenarnya

Triple Top
was formed on 15.04 at 08:00:07 (UTC+0)
signal strength 3 of 5
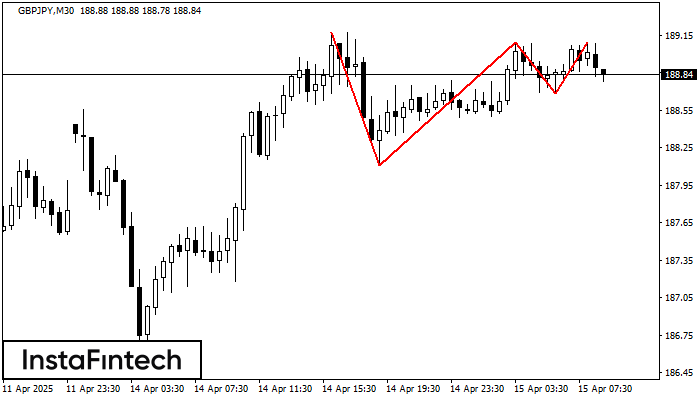
On the chart of the GBPJPY M30 trading instrument, the Triple Top pattern that signals a trend change has formed. It is possible that after formation of the third peak, the price will try to break through the resistance level 188.11, where we advise to open a trading position for sale. Take profit is the projection of the pattern’s width, which is 106 points.
Lihat juga
- All
- All
- Bearish Rectangle
- Bearish Symmetrical Triangle
- Bearish Symmetrical Triangle
- Bullish Rectangle
- Double Top
- Double Top
- Triple Bottom
- Triple Bottom
- Triple Top
- Triple Top
- All
- All
- Buy
- Sale
- All
- 1
- 2
- 3
- 4
- 5
Persegi Bearish
was formed on 06.06 at 10:09:18 (UTC+0)
signal strength 1 of 5
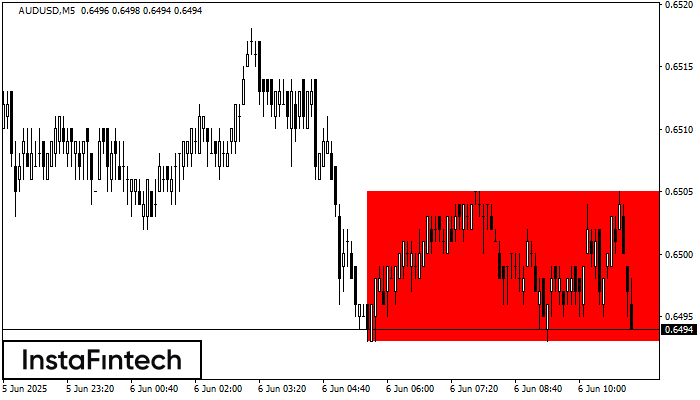
Menurut grafik dari M5, AUDUSD terbentuk Persegi Bearish. Jenis pola ini menunjukkan kelanjutan tren. Terdiri dari dua tingkat: resistance 0.6505 - 0.0000 dan support 0.6493 – 0.6493. Jika level resistance
Rangka waktu M5 dan M15 mungkin memiliki lebih dari titik entri yang keliru.
Open chart in a new window
Kepala dan bahu
was formed on 06.06 at 10:05:40 (UTC+0)
signal strength 1 of 5
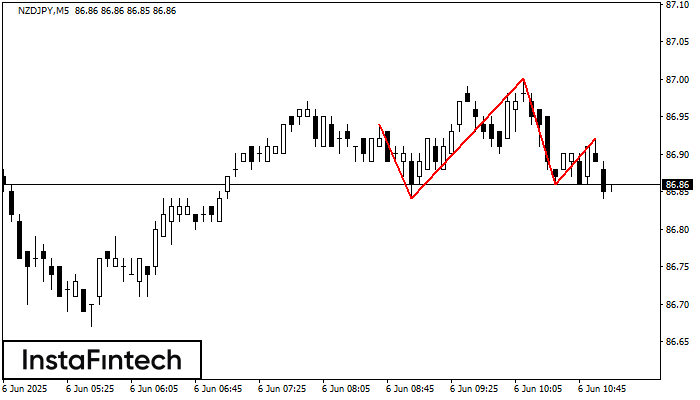
Pola teknikal yang disebut Kepala dan bahu telah muncul pada grafik NZDJPY M5. Terdapat banyak alasan untuk harga melewati Neckline 86.84/86.86 setelah Shoulder kanan terbentuk. Jadi, tren akan berubah dengan
Rangka waktu M5 dan M15 mungkin memiliki lebih dari titik entri yang keliru.
Open chart in a new window
Persegi Bearish
was formed on 06.06 at 10:01:59 (UTC+0)
signal strength 2 of 5
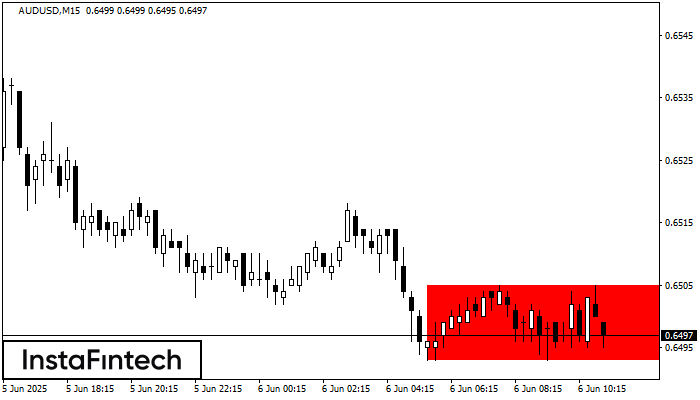
Menurut grafik dari M15, AUDUSD terbentuk Persegi Bearish. Jenis pola ini menunjukkan kelanjutan tren. Terdiri dari dua tingkat: resistance 0.6505 - 0.0000 dan support 0.6493 – 0.6493. Jika level resistance
Rangka waktu M5 dan M15 mungkin memiliki lebih dari titik entri yang keliru.
Open chart in a new window


