

Pola sebenarnya

Bearish pennant
was formed on 15.04 at 03:46:46 (UTC+0)
signal strength 1 of 5

The Bearish pennant pattern has formed on the GBPAUD M5 chart. This pattern type is characterized by a slight slowdown after which the price will move in the direction of the original trend. In case the price fixes below the pattern’s low of 2.0754, a trader will be able to successfully enter the sell position.
The M5 and M15 time frames may have more false entry points.
Lihat juga
- All
- All
- Bearish Rectangle
- Bearish Symmetrical Triangle
- Bearish Symmetrical Triangle
- Bullish Rectangle
- Double Top
- Double Top
- Triple Bottom
- Triple Bottom
- Triple Top
- Triple Top
- All
- All
- Buy
- Sale
- All
- 1
- 2
- 3
- 4
- 5
Persegi Bullish
was formed on 29.05 at 23:04:26 (UTC+0)
signal strength 5 of 5
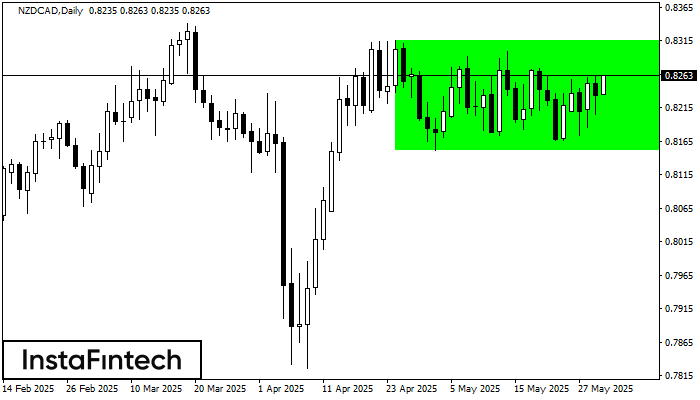
Menurut grafik dari D1, NZDCAD terbentuk Persegi Bullish. Pola menunjukkan kelanjutan tren. Batas atas adalah 0.8316, batas lebih rendah adalah 0.8151. Sinyal berarti posisi beli harus dibuka diatas batas atas
Open chart in a new window
Segitiga Simetris Bearish
was formed on 29.05 at 22:19:03 (UTC+0)
signal strength 1 of 5
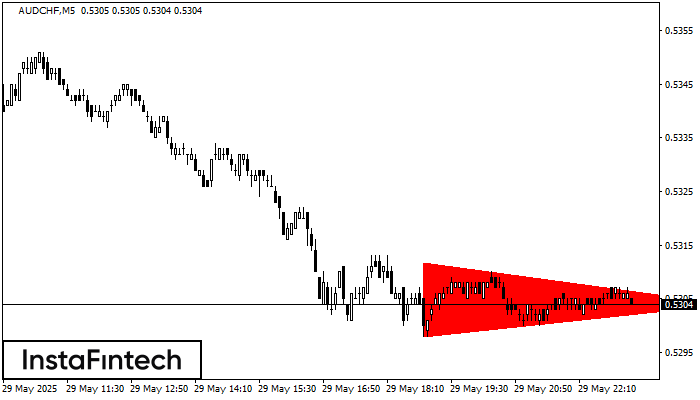
Menurut Grafik dari M5, AUDCHF dibentuk pola Segitiga Simetris Bearish. Rekomendasi Trading: Penembusan dari batas yang lebih rendah 0.5298 kemungkinan akan mendorong kelanjutan dari tren penurunan
Rangka waktu M5 dan M15 mungkin memiliki lebih dari titik entri yang keliru.
Open chart in a new window
Bendera Bullish
was formed on 29.05 at 22:16:27 (UTC+0)
signal strength 3 of 5
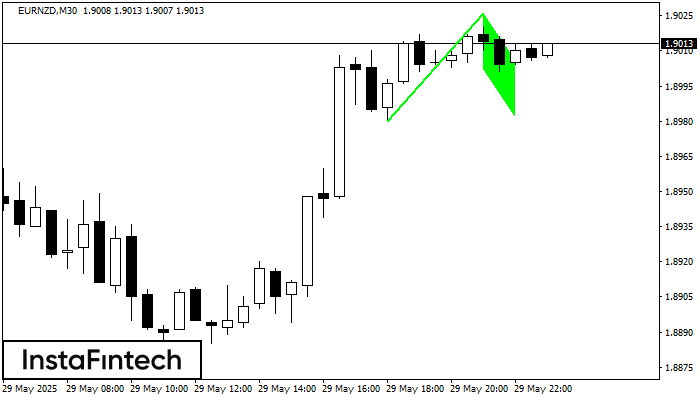
Pola Bendera Bullish yang memberikan sinyal kelanjutan tren telah terbentuk di grafik EURNZD M30. Prakiraan: jika harga menembus ke atas titik tertinggi harga di 1.9026, maka para trader akan dapat
Open chart in a new window


