

Pola sebenarnya

Triple Top
was formed on 15.04 at 03:00:15 (UTC+0)
signal strength 2 of 5
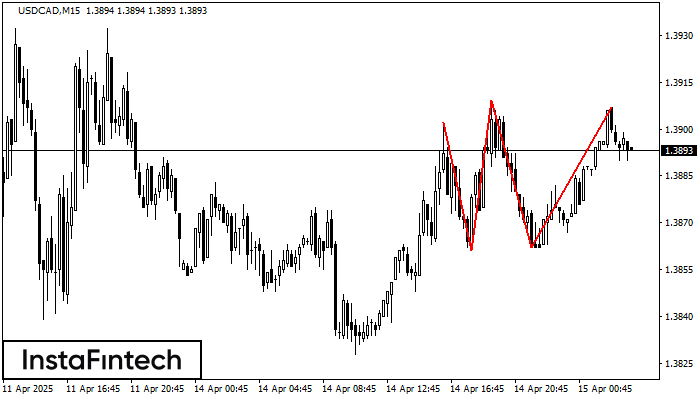
The Triple Top pattern has formed on the chart of the USDCAD M15 trading instrument. It is a reversal pattern featuring the following characteristics: resistance level -5, support level -1, and pattern’s width 41. Forecast If the price breaks through the support level 1.3861, it is likely to move further down to 1.3886.
The M5 and M15 time frames may have more false entry points.
Lihat juga
- All
- All
- Bearish Rectangle
- Bearish Symmetrical Triangle
- Bearish Symmetrical Triangle
- Bullish Rectangle
- Double Top
- Double Top
- Triple Bottom
- Triple Bottom
- Triple Top
- Triple Top
- All
- All
- Buy
- Sale
- All
- 1
- 2
- 3
- 4
- 5
Double Top
was formed on 06.06 at 22:30:10 (UTC+0)
signal strength 2 of 5

On the chart of USDCAD M15 the Double Top reversal pattern has been formed. Characteristics: the upper boundary 1.3702; the lower boundary 1.3668; the width of the pattern 34 points
The M5 and M15 time frames may have more false entry points.
Open chart in a new window
Bullish Symmetrical Triangle
was formed on 06.06 at 22:18:11 (UTC+0)
signal strength 2 of 5

According to the chart of M15, AUDJPY formed the Bullish Symmetrical Triangle pattern. The lower border of the pattern touches the coordinates 93.96/94.02 whereas the upper border goes across 94.07/94.02
The M5 and M15 time frames may have more false entry points.
Open chart in a new window
Triple Bottom
was formed on 06.06 at 22:01:08 (UTC+0)
signal strength 3 of 5

The Triple Bottom pattern has formed on the chart of the GBPAUD M30 trading instrument. The pattern signals a change in the trend from downwards to upwards in the case
Open chart in a new window


