

Pola sebenarnya

Inverse Head and Shoulder
was formed on 14.04 at 23:05:42 (UTC+0)
signal strength 1 of 5
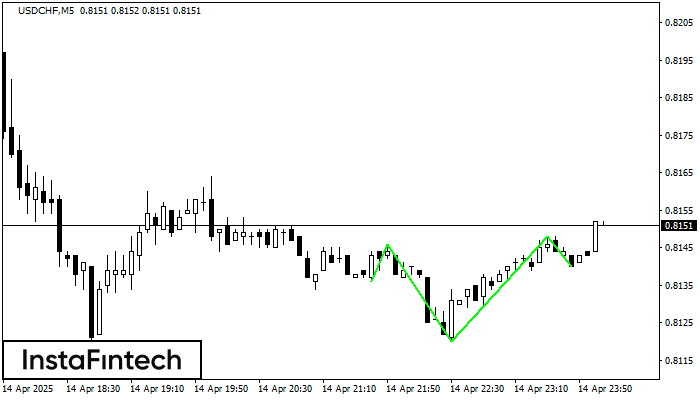
According to the chart of M5, USDCHF formed the Inverse Head and Shoulder pattern. The Head’s top is set at 0.8148 while the median line of the Neck is found at 0.8120/0.8140. The formation of the Inverse Head and Shoulder pattern evidently signals a reversal of the downward trend. In other words, in case the scenario comes true, the price of USDCHF will go towards 0.8163
The M5 and M15 time frames may have more false entry points.
- All
- All
- Bearish Rectangle
- Bearish Symmetrical Triangle
- Bearish Symmetrical Triangle
- Bullish Rectangle
- Double Top
- Double Top
- Triple Bottom
- Triple Bottom
- Triple Top
- Triple Top
- All
- All
- Buy
- Sale
- All
- 1
- 2
- 3
- 4
- 5
Bawah Triple
was formed on 28.05 at 21:05:58 (UTC+0)
signal strength 1 of 5
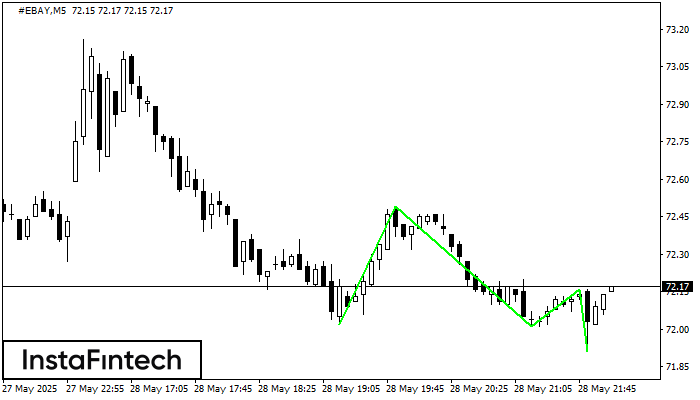
Pola Bawah Triple telah terbentuk pada grafik instrumen trading #EBAY M5. Pola tersebut menandakan perubahan dalam trend dari menurun menjadi naik jika terjadi pemecahan (breakdown) 72.49/72.16
Rangka waktu M5 dan M15 mungkin memiliki lebih dari titik entri yang keliru.
Open chart in a new window
Teratas Ganda
was formed on 28.05 at 21:00:23 (UTC+0)
signal strength 3 of 5
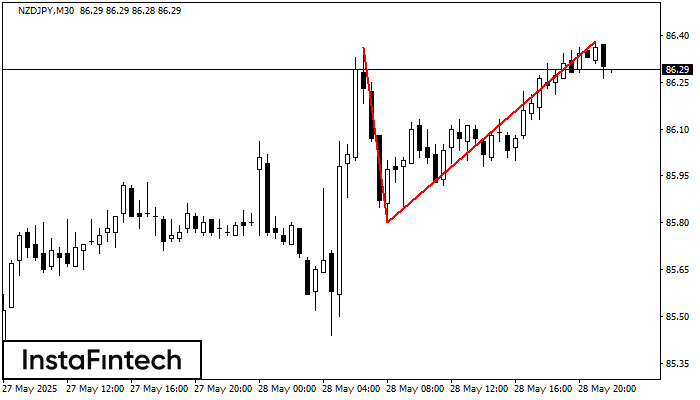
Pada grafik NZDJPY M30 pola reversal Teratas Ganda telah terbentuk. Karakteristik: batas atas 86.38; batas bawah 85.80; lebar pola 58 poin. Sinyal: tembusan ke batas bawah akan menyebabkan kelanjutan tren
Open chart in a new window
Bawah Ganda
was formed on 28.05 at 20:55:28 (UTC+0)
signal strength 1 of 5
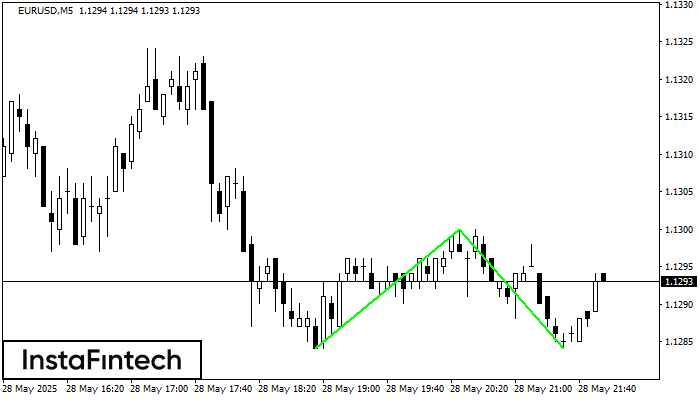
Pola Bawah Ganda telah terbentuk pada EURUSD M5. Karakteristik: level support 1.1284; level resistance 1.1300; lebar pola 16 poin. Jika level resistance ditembus, perubahan dalam tren dapat diprediksi dengan target
Rangka waktu M5 dan M15 mungkin memiliki lebih dari titik entri yang keliru.
Open chart in a new window


