

Pola sebenarnya

Double Top
was formed on 14.04 at 22:30:29 (UTC+0)
signal strength 3 of 5
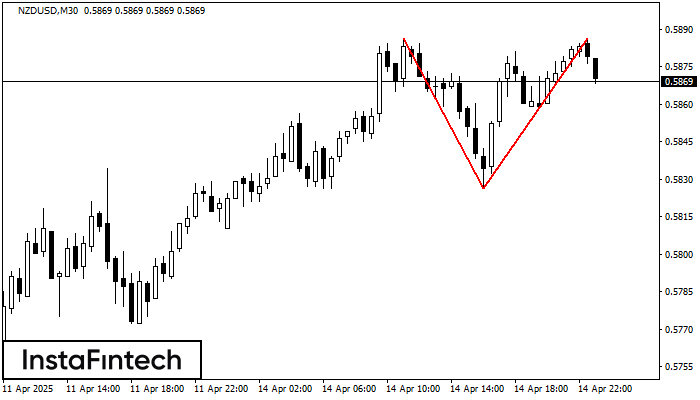
The Double Top reversal pattern has been formed on NZDUSD M30. Characteristics: the upper boundary 0.5886; the lower boundary 0.5826; the width of the pattern is 60 points. Sell trades are better to be opened below the lower boundary 0.5826 with a possible movements towards the 0.5796 level.
- All
- All
- Bearish Rectangle
- Bearish Symmetrical Triangle
- Bearish Symmetrical Triangle
- Bullish Rectangle
- Double Top
- Double Top
- Triple Bottom
- Triple Bottom
- Triple Top
- Triple Top
- All
- All
- Buy
- Sale
- All
- 1
- 2
- 3
- 4
- 5
Segitiga Simetris Bullish
was formed on 02.06 at 16:53:37 (UTC+0)
signal strength 5 of 5
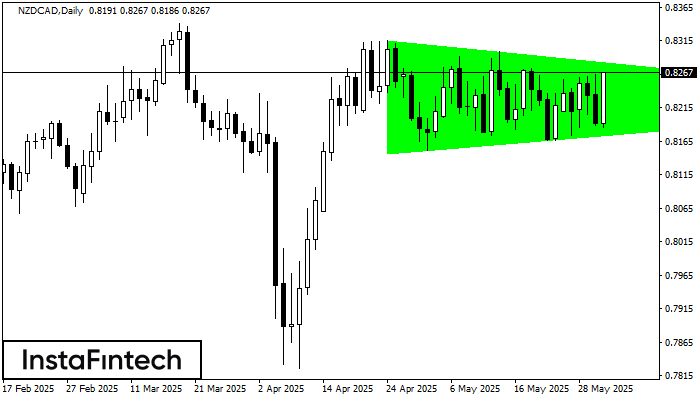
Menurut Grafik dari D1, NZDCAD dibentuk pola Segitiga Simetris Bullish. Batas yang lebih rendah dari pola menyentuh kordinat 0.8146/0.8223 dimana batas atas berada sepanjang 0.8316/0.8223. Jika pola Segitiga Simetris Bullish
Open chart in a new window
Persegi Bearish
was formed on 02.06 at 16:03:51 (UTC+0)
signal strength 5 of 5

Menurut grafik dari D1, #PEP terbentuk Persegi Bearish. Jenis pola ini menunjukkan kelanjutan tren. Terdiri dari dua tingkat: resistance 132.70 - 0.00 dan support 127.74 – 127.74. Jika level resistance
Open chart in a new window
Persegi Bearish
was formed on 02.06 at 16:03:49 (UTC+0)
signal strength 5 of 5
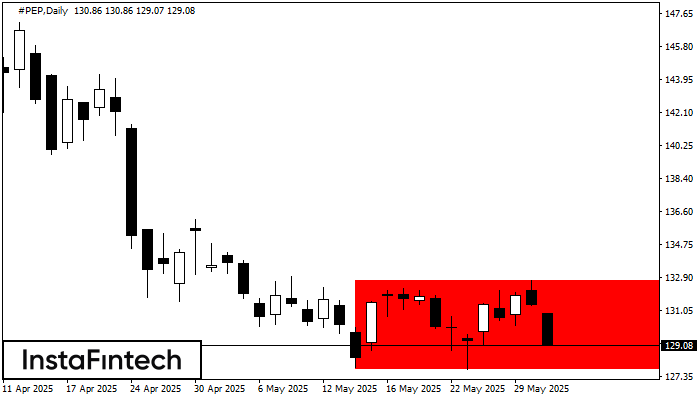
Menurut grafik dari D1, #PEP terbentuk Persegi Bearish yang merupakan pola dari kelanjutan tren. Pola terkandung di dalam batas berikut: batas lebih rendah 127.74 – 127.74 dan batas atas 132.70
Open chart in a new window


