

Pola sebenarnya

Bearish Symmetrical Triangle
was formed on 14.04 at 21:53:03 (UTC+0)
signal strength 1 of 5
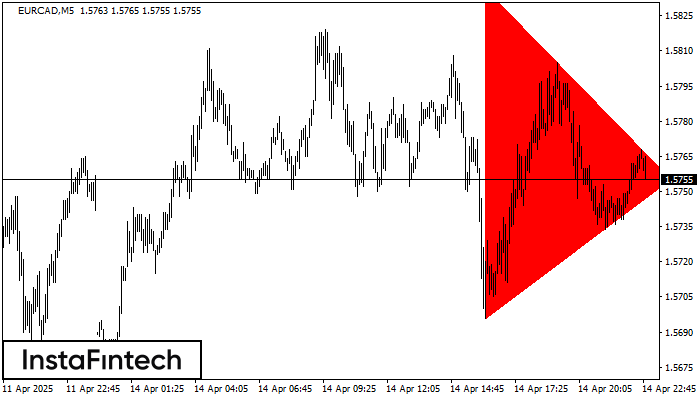
According to the chart of M5, EURCAD formed the Bearish Symmetrical Triangle pattern. This pattern signals a further downward trend in case the lower border 1.5696 is breached. Here, a hypothetical profit will equal the width of the available pattern that is -141 pips.
The M5 and M15 time frames may have more false entry points.
- All
- All
- Bearish Rectangle
- Bearish Symmetrical Triangle
- Bearish Symmetrical Triangle
- Bullish Rectangle
- Double Top
- Double Top
- Triple Bottom
- Triple Bottom
- Triple Top
- Triple Top
- All
- All
- Buy
- Sale
- All
- 1
- 2
- 3
- 4
- 5
Double Bottom
сформирован 06.06 в 00:25:20 (UTC+0)
сила сигнала 1 из 5
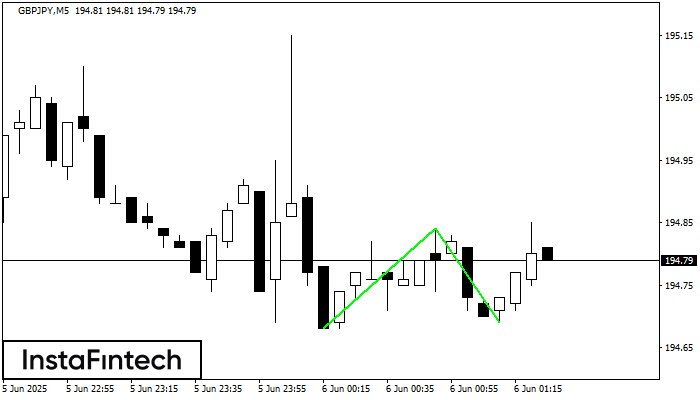
The Double Bottom pattern has been formed on GBPJPY M5. Characteristics: the support level 194.68; the resistance level 194.84; the width of the pattern 16 points. If the resistance level
The M5 and M15 time frames may have more false entry points.
Открыть график инструмента в новом окне
Double Bottom
сформирован 06.06 в 00:20:24 (UTC+0)
сила сигнала 1 из 5
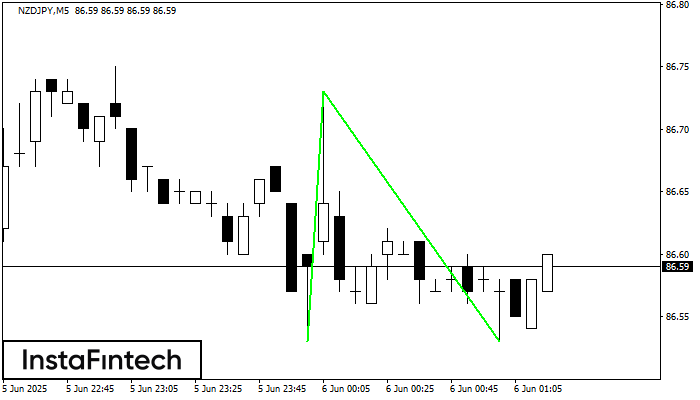
The Double Bottom pattern has been formed on NZDJPY M5; the upper boundary is 86.73; the lower boundary is 86.53. The width of the pattern is 20 points. In case
The M5 and M15 time frames may have more false entry points.
Открыть график инструмента в новом окне
Double Bottom
сформирован 05.06 в 22:50:11 (UTC+0)
сила сигнала 1 из 5
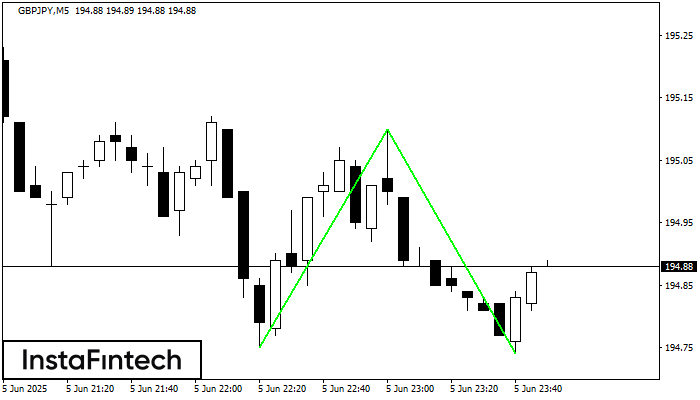
The Double Bottom pattern has been formed on GBPJPY M5; the upper boundary is 195.10; the lower boundary is 194.74. The width of the pattern is 35 points. In case
The M5 and M15 time frames may have more false entry points.
Открыть график инструмента в новом окне


