

Pola sebenarnya

Double Top
was formed on 14.04 at 18:25:23 (UTC+0)
signal strength 1 of 5
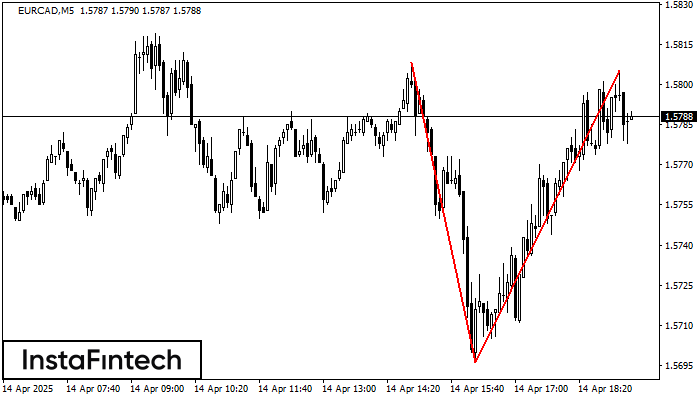
On the chart of EURCAD M5 the Double Top reversal pattern has been formed. Characteristics: the upper boundary 1.5805; the lower boundary 1.5696; the width of the pattern 109 points. The signal: a break of the lower boundary will cause continuation of the downward trend targeting the 1.5681 level.
The M5 and M15 time frames may have more false entry points.
- All
- All
- Bearish Rectangle
- Bearish Symmetrical Triangle
- Bearish Symmetrical Triangle
- Bullish Rectangle
- Double Top
- Double Top
- Triple Bottom
- Triple Bottom
- Triple Top
- Triple Top
- All
- All
- Buy
- Sale
- All
- 1
- 2
- 3
- 4
- 5
Double Top
was formed on 02.06 at 03:20:17 (UTC+0)
signal strength 1 of 5
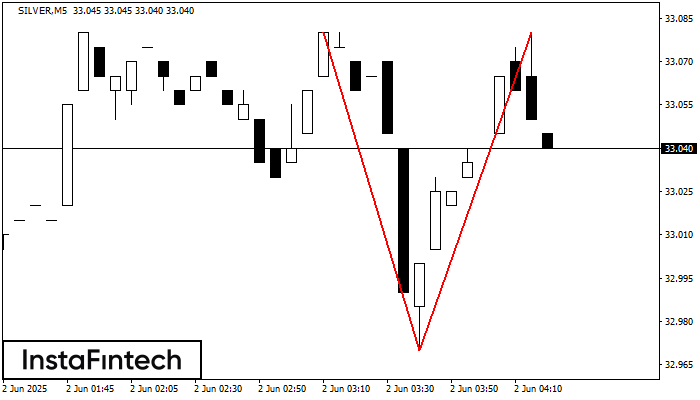
The Double Top pattern has been formed on SILVER M5. It signals that the trend has been changed from upwards to downwards. Probably, if the base of the pattern 32.97
The M5 and M15 time frames may have more false entry points.
Open chart in a new window
Bullish pennant
was formed on 02.06 at 02:15:09 (UTC+0)
signal strength 2 of 5
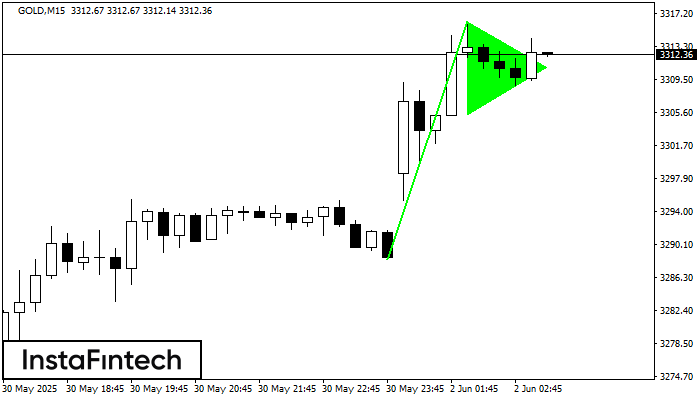
The Bullish pennant pattern is formed on the GOLD M15 chart. It is a type of the continuation pattern. Supposedly, in case the price is fixed above the pennant’s high
The M5 and M15 time frames may have more false entry points.
Open chart in a new window
Double Top
was formed on 02.06 at 02:00:45 (UTC+0)
signal strength 2 of 5
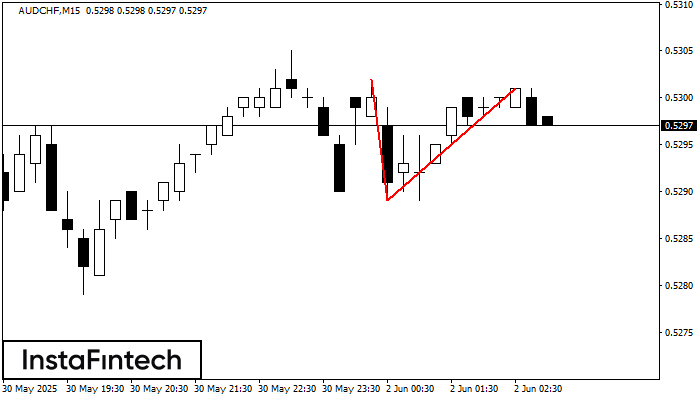
On the chart of AUDCHF M15 the Double Top reversal pattern has been formed. Characteristics: the upper boundary 0.5301; the lower boundary 0.5289; the width of the pattern 12 points
The M5 and M15 time frames may have more false entry points.
Open chart in a new window

