

Pola sebenarnya

Double Top
was formed on 14.04 at 16:45:14 (UTC+0)
signal strength 2 of 5
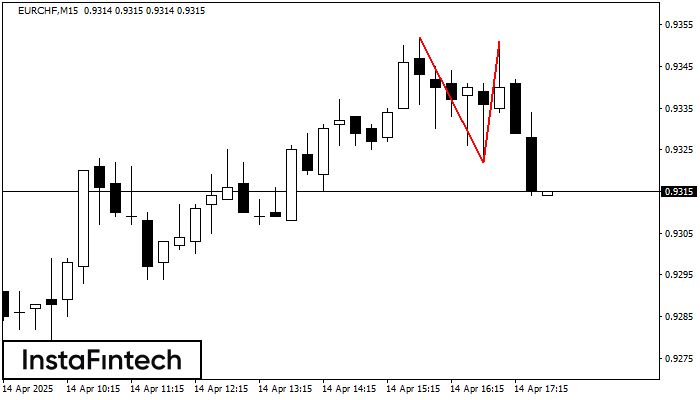
On the chart of EURCHF M15 the Double Top reversal pattern has been formed. Characteristics: the upper boundary 0.9351; the lower boundary 0.9322; the width of the pattern 29 points. The signal: a break of the lower boundary will cause continuation of the downward trend targeting the 0.9299 level.
The M5 and M15 time frames may have more false entry points.
- All
- All
- Bearish Rectangle
- Bearish Symmetrical Triangle
- Bearish Symmetrical Triangle
- Bullish Rectangle
- Double Top
- Double Top
- Triple Bottom
- Triple Bottom
- Triple Top
- Triple Top
- All
- All
- Buy
- Sale
- All
- 1
- 2
- 3
- 4
- 5
Segitiga Simetris Bullish
was formed on 24.05 at 18:46:25 (UTC+0)
signal strength 2 of 5

Menurut Grafik dari M15, #Bitcoin dibentuk pola Segitiga Simetris Bullish, yang menunjukkan tren akan berlanjut. Deksripsi. Batas atas dari pola menyentuh kordinat 109440.14/108872.57 dimana batas yang lebih rendah berada sepanjang
Rangka waktu M5 dan M15 mungkin memiliki lebih dari titik entri yang keliru.
Open chart in a new window
Persegi Bearish
was formed on 23.05 at 23:00:20 (UTC+0)
signal strength 1 of 5

Menurut grafik dari M5, EURNZD terbentuk Persegi Bearish. Pola menunjukkan kelanjutan tren. Batas atas adalah 1.8982, batas rendah adalah 1.8964. Sinyal berarti posisi jual harus dibuka setelah menetapkan harga dibawah
Rangka waktu M5 dan M15 mungkin memiliki lebih dari titik entri yang keliru.
Open chart in a new window
Segitiga Simetris Bullish
was formed on 23.05 at 22:14:53 (UTC+0)
signal strength 1 of 5

Menurut Grafik dari M5, AUDCHF dibentuk pola Segitiga Simetris Bullish. Deskripsi: Ini merupakan pola dari kelanjutan tren. 0.5335 dan 0.5329 adalah kordinat masing-masing dari batas atas dan lebih rendah. Lebar
Rangka waktu M5 dan M15 mungkin memiliki lebih dari titik entri yang keliru.
Open chart in a new window

