

Pola sebenarnya

Bullish Rectangle
was formed on 14.04 at 13:29:26 (UTC+0)
signal strength 2 of 5
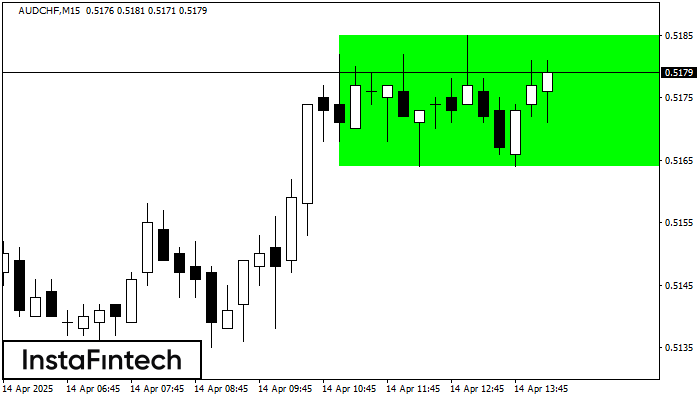
According to the chart of M15, AUDCHF formed the Bullish Rectangle which is a pattern of a trend continuation. The pattern is contained within the following borders: the lower border 0.5164 – 0.5164 and upper border 0.5185 – 0.5185. In case the upper border is broken, the instrument is likely to follow the upward trend.
The M5 and M15 time frames may have more false entry points.
Lihat juga
- All
- All
- Bearish Rectangle
- Bearish Symmetrical Triangle
- Bearish Symmetrical Triangle
- Bullish Rectangle
- Double Top
- Double Top
- Triple Bottom
- Triple Bottom
- Triple Top
- Triple Top
- All
- All
- Buy
- Sale
- All
- 1
- 2
- 3
- 4
- 5
Persegi Bullish
was formed on 31.05 at 19:15:46 (UTC+0)
signal strength 1 of 5

Menurut grafik dari M5, #Bitcoin terbentuk Persegi Bullish yang merupakan pola dari kelanjutan tren. Pola terkandung dalam batas berikut: batas yang lebih rendah 104335.43 – 104335.43 dan batas atas 104800.13
Rangka waktu M5 dan M15 mungkin memiliki lebih dari titik entri yang keliru.
Open chart in a new window
Bawah Ganda
was formed on 31.05 at 13:20:01 (UTC+0)
signal strength 1 of 5

Pola Bawah Ganda telah terbentuk pada #Bitcoin M5. Karakteristik: level support 103250.25; level resistance 103385.09; lebar pola 13484 poin. Jika level resistance ditembus, perubahan dalam tren dapat diprediksi dengan target
Rangka waktu M5 dan M15 mungkin memiliki lebih dari titik entri yang keliru.
Open chart in a new window
Teratas Triple
was formed on 30.05 at 22:20:23 (UTC+0)
signal strength 1 of 5

Pola Teratas Triple telah terbentuk pada grafik instrumen trading GOLD M5. Pola tersebut merupakan pola reversal menampilkan karakteristik berikut: level resistance 4, levek support -193, dan lebar pola 613. Prakiraan
Rangka waktu M5 dan M15 mungkin memiliki lebih dari titik entri yang keliru.
Open chart in a new window


