

Pola sebenarnya

Bullish Rectangle
was formed on 14.04 at 13:01:10 (UTC+0)
signal strength 1 of 5
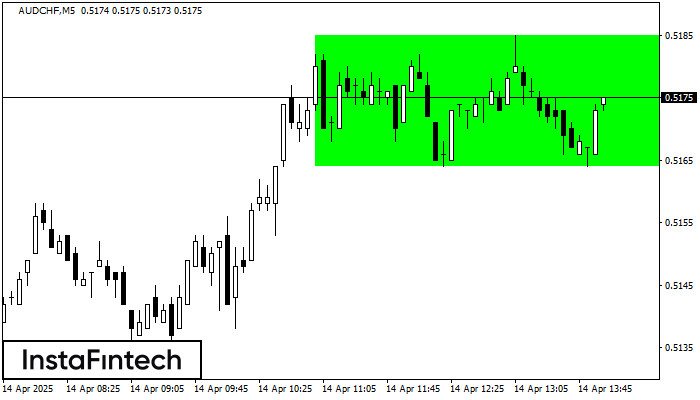
According to the chart of M5, AUDCHF formed the Bullish Rectangle. The pattern indicates a trend continuation. The upper border is 0.5185, the lower border is 0.5164. The signal means that a long position should be opened above the upper border 0.5185 of the Bullish Rectangle.
The M5 and M15 time frames may have more false entry points.
Lihat juga
- All
- All
- Bearish Rectangle
- Bearish Symmetrical Triangle
- Bearish Symmetrical Triangle
- Bullish Rectangle
- Double Top
- Double Top
- Triple Bottom
- Triple Bottom
- Triple Top
- Triple Top
- All
- All
- Buy
- Sale
- All
- 1
- 2
- 3
- 4
- 5
Teratas Ganda
was formed on 22.08 at 07:30:33 (UTC+0)
signal strength 3 of 5
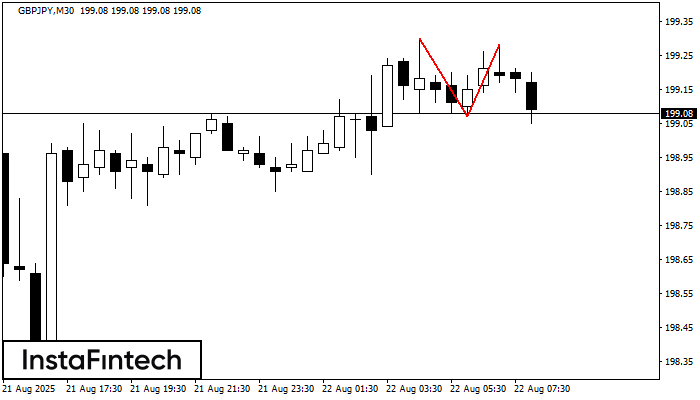
Pola reversal Teratas Ganda telah terbentuk pada GBPJPY M30. Karakteristik: batas atas 199.30; batas bawah 199.07; lebar pola 21 poin. Transaksi jual lebih baik dibuka di bawah batas bawah 199.07
Open chart in a new window
Persegi Bearish
was formed on 22.08 at 06:30:53 (UTC+0)
signal strength 4 of 5
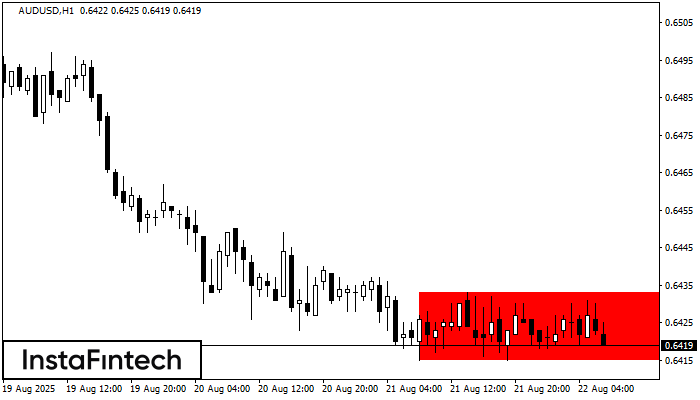
Menurut grafik dari H1, AUDUSD terbentuk Persegi Bearish. Pola menunjukkan kelanjutan tren. Batas atas adalah 0.6433, batas rendah adalah 0.6415. Sinyal berarti posisi jual harus dibuka setelah menetapkan harga dibawah
Open chart in a new window
Teratas Ganda
was formed on 22.08 at 06:25:28 (UTC+0)
signal strength 1 of 5
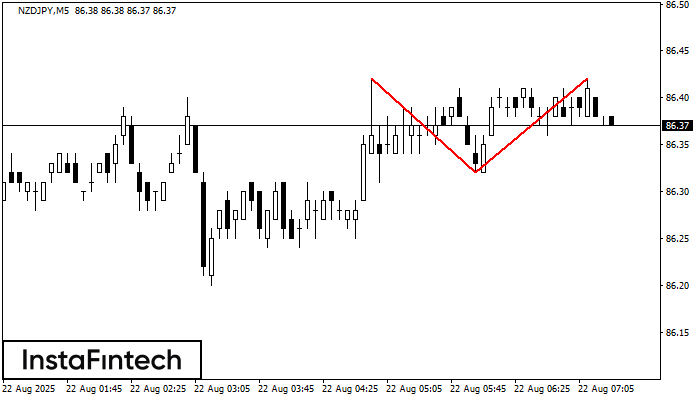
Pola reversal Teratas Ganda telah terbentuk pada NZDJPY M5. Karakteristik: batas atas 86.42; batas bawah 86.32; lebar pola 10 poin. Transaksi jual lebih baik dibuka di bawah batas bawah 86.32
Rangka waktu M5 dan M15 mungkin memiliki lebih dari titik entri yang keliru.
Open chart in a new window


