

Pola sebenarnya

Double Top
was formed on 14.04 at 02:00:14 (UTC+0)
signal strength 1 of 5
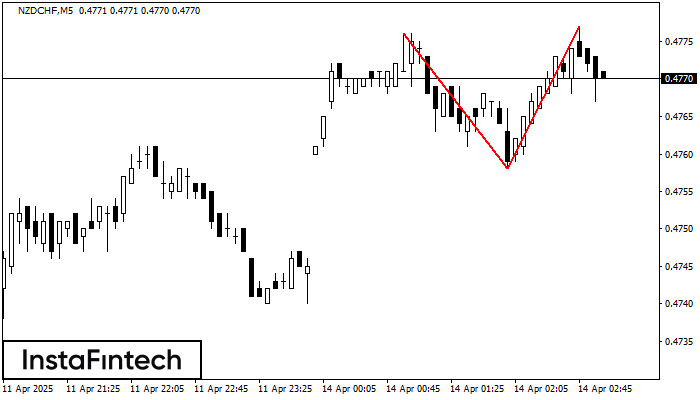
The Double Top reversal pattern has been formed on NZDCHF M5. Characteristics: the upper boundary 0.4776; the lower boundary 0.4758; the width of the pattern is 19 points. Sell trades are better to be opened below the lower boundary 0.4758 with a possible movements towards the 0.4743 level.
The M5 and M15 time frames may have more false entry points.
Lihat juga
- All
- All
- Bearish Rectangle
- Bearish Symmetrical Triangle
- Bearish Symmetrical Triangle
- Bullish Rectangle
- Double Top
- Double Top
- Triple Bottom
- Triple Bottom
- Triple Top
- Triple Top
- All
- All
- Buy
- Sale
- All
- 1
- 2
- 3
- 4
- 5
Double Bottom
was formed on 08.08 at 22:31:28 (UTC+0)
signal strength 1 of 5
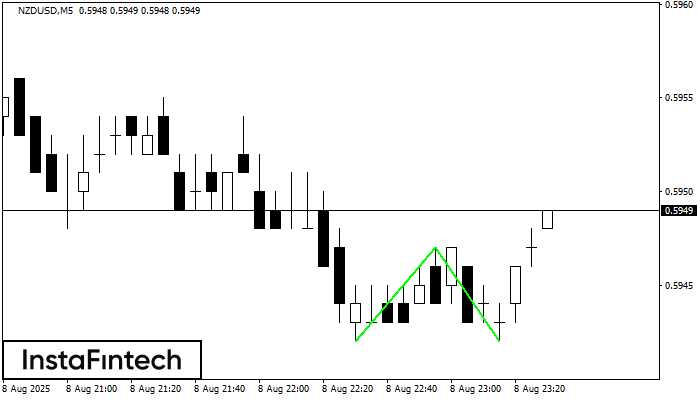
The Double Bottom pattern has been formed on NZDUSD M5; the upper boundary is 0.5947; the lower boundary is 0.5942. The width of the pattern is 5 points. In case
The M5 and M15 time frames may have more false entry points.
Open chart in a new window
Double Top
was formed on 08.08 at 21:30:13 (UTC+0)
signal strength 3 of 5
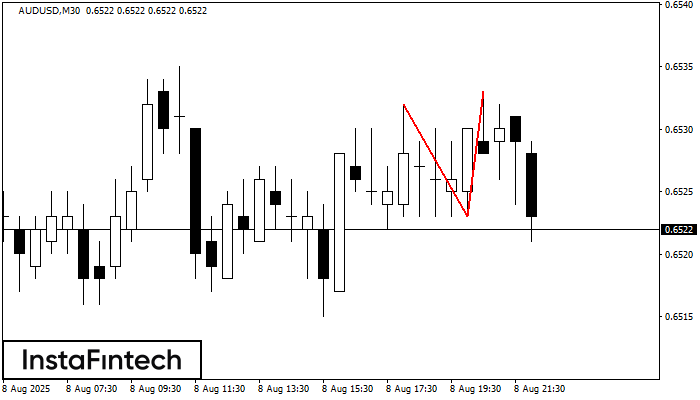
The Double Top pattern has been formed on AUDUSD M30. It signals that the trend has been changed from upwards to downwards. Probably, if the base of the pattern 0.6523
Open chart in a new window
Bullish pennant
was formed on 08.08 at 21:12:19 (UTC+0)
signal strength 3 of 5
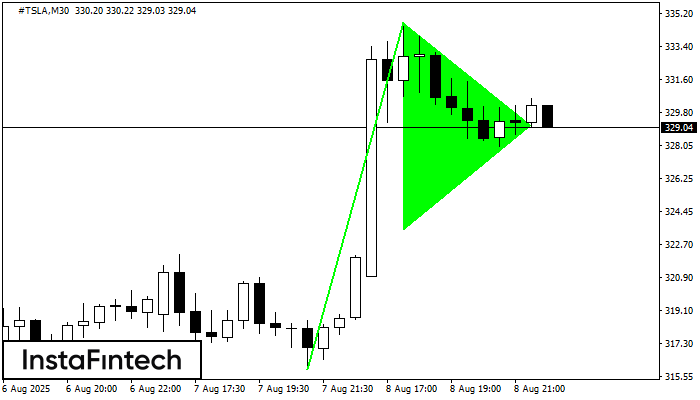
The Bullish pennant pattern is formed on the #TSLA M30 chart. It is a type of the continuation pattern. Supposedly, in case the price is fixed above the pennant’s high
Open chart in a new window


