

Pola sebenarnya

Bullish Rectangle
was formed on 14.04 at 01:17:49 (UTC+0)
signal strength 2 of 5
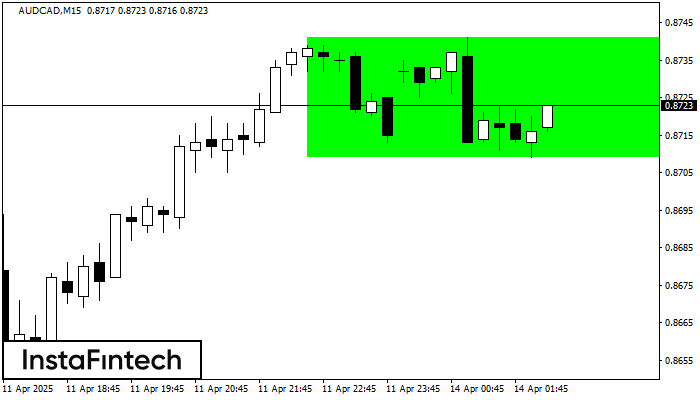
According to the chart of M15, AUDCAD formed the Bullish Rectangle. This type of a pattern indicates a trend continuation. It consists of two levels: resistance 0.8741 and support 0.8709. In case the resistance level 0.8741 - 0.8741 is broken, the instrument is likely to follow the bullish trend.
The M5 and M15 time frames may have more false entry points.
Lihat juga
- All
- All
- Bearish Rectangle
- Bearish Symmetrical Triangle
- Bearish Symmetrical Triangle
- Bullish Rectangle
- Double Top
- Double Top
- Triple Bottom
- Triple Bottom
- Triple Top
- Triple Top
- All
- All
- Buy
- Sale
- All
- 1
- 2
- 3
- 4
- 5
Doble Techo
was formed on 01.06 at 01:00:35 (UTC+0)
signal strength 3 of 5

El patrón de reversión Doble Techo ha sido formado en #Bitcoin M30. Características: el límite superior 104800.13; el límite inferior 104215.56; el ancho del patrón es 64024 puntos. Es mejor
Open chart in a new window
Doble Piso
was formed on 30.05 at 12:31:28 (UTC+0)
signal strength 3 of 5
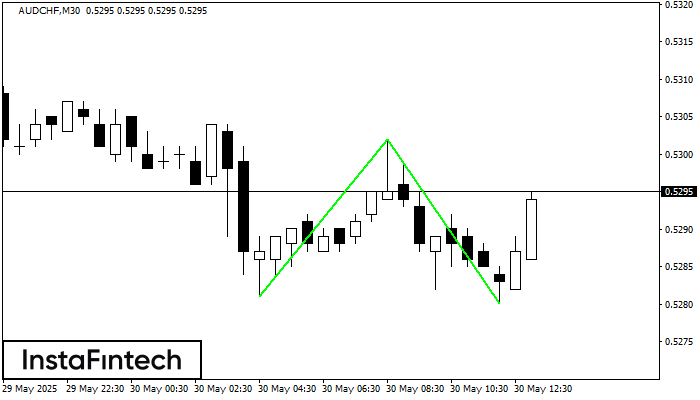
El patrón Doble Piso ha sido formado en AUDCHF M30. Características: el nivel de soporte 0.5281; el nivel de resistencia 0.5302; el ancho del patrón 21 puntos. Si el nivel
Open chart in a new window
Doble Piso
was formed on 30.05 at 08:30:30 (UTC+0)
signal strength 3 of 5
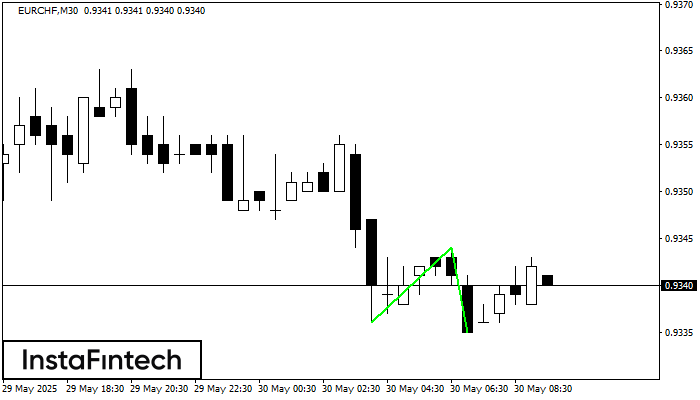
El patrón Doble Piso ha sido formado en EURCHF M30. Esta formación señala una reversión de la tendencia de bajista a alcista. La señal es que se debe abrir
Open chart in a new window


