

Pola sebenarnya

Double Top
was formed on 14.04 at 00:15:19 (UTC+0)
signal strength 1 of 5
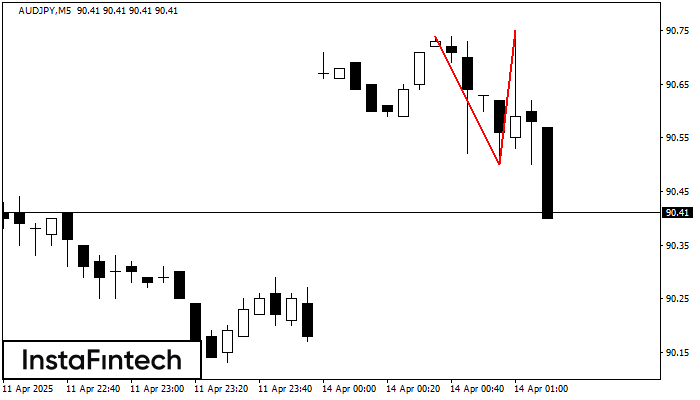
On the chart of AUDJPY M5 the Double Top reversal pattern has been formed. Characteristics: the upper boundary 90.75; the lower boundary 90.50; the width of the pattern 25 points. The signal: a break of the lower boundary will cause continuation of the downward trend targeting the 90.35 level.
The M5 and M15 time frames may have more false entry points.
Lihat juga
- All
- All
- Bearish Rectangle
- Bearish Symmetrical Triangle
- Bearish Symmetrical Triangle
- Bullish Rectangle
- Double Top
- Double Top
- Triple Bottom
- Triple Bottom
- Triple Top
- Triple Top
- All
- All
- Buy
- Sale
- All
- 1
- 2
- 3
- 4
- 5
Persegi Bearish
was formed on 06.06 at 10:01:59 (UTC+0)
signal strength 2 of 5
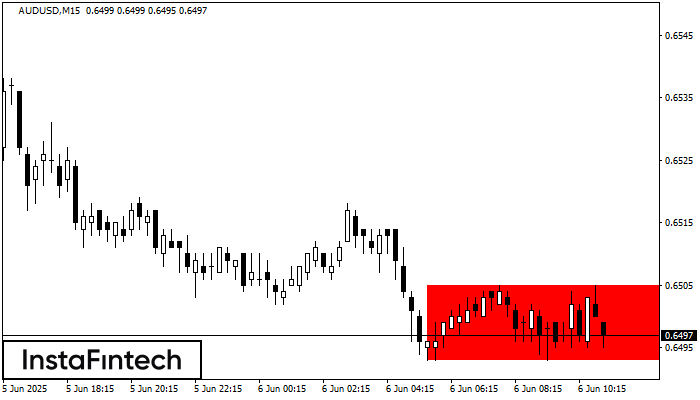
Menurut grafik dari M15, AUDUSD terbentuk Persegi Bearish. Jenis pola ini menunjukkan kelanjutan tren. Terdiri dari dua tingkat: resistance 0.6505 - 0.0000 dan support 0.6493 – 0.6493. Jika level resistance
Rangka waktu M5 dan M15 mungkin memiliki lebih dari titik entri yang keliru.
Open chart in a new window
Bawah Ganda
was formed on 06.06 at 10:00:09 (UTC+0)
signal strength 3 of 5
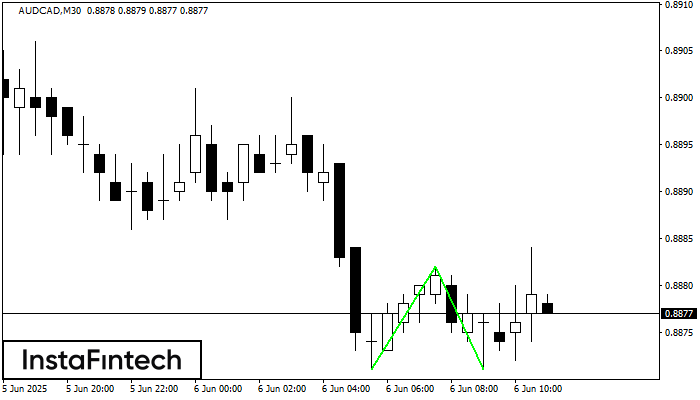
Pola Bawah Ganda telah terbentuk pada AUDCAD M30. Formasi ini mensinyalkan reversal tren dari arah penurunan ke arah kenaikan. Sinyal menunjukkan bahwa transaksi beli harus dibuka setelah batas atas pola
Open chart in a new window
Segitiga Simetris Bearish
was formed on 06.06 at 09:32:08 (UTC+0)
signal strength 1 of 5
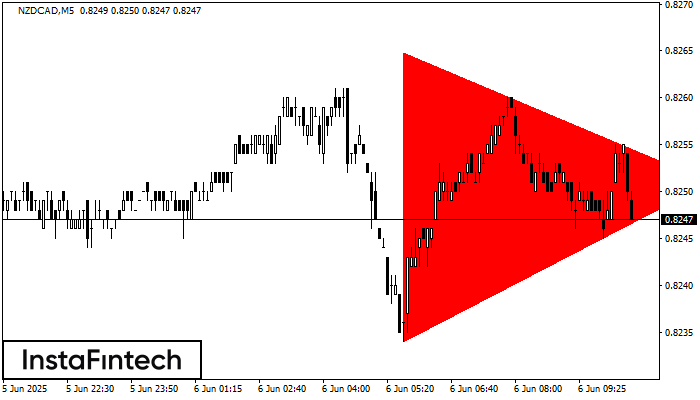
Menurut Grafik dari M5, NZDCAD dibentuk pola Segitiga Simetris Bearish. Deskripsi: Batas yang lebih rendah adalah 0.8234/0.8251 dan batas atas adalah 0.8265/0.8251. Lebar pola diukur dalam grafik di -31 pips
Rangka waktu M5 dan M15 mungkin memiliki lebih dari titik entri yang keliru.
Open chart in a new window


