

Pola sebenarnya

Triple Top
was formed on 14.04 at 00:05:17 (UTC+0)
signal strength 1 of 5
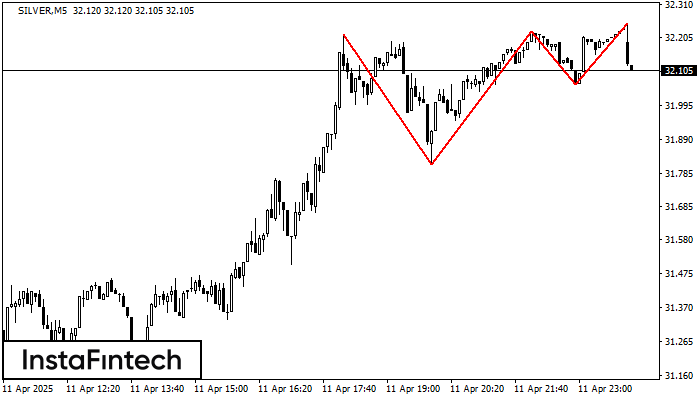
The Triple Top pattern has formed on the chart of the SILVER M5 trading instrument. It is a reversal pattern featuring the following characteristics: resistance level -35, support level -245, and pattern’s width 400. Forecast If the price breaks through the support level 31.82, it is likely to move further down to 32.21.
The M5 and M15 time frames may have more false entry points.
Lihat juga
- All
- All
- Bearish Rectangle
- Bearish Symmetrical Triangle
- Bearish Symmetrical Triangle
- Bullish Rectangle
- Double Top
- Double Top
- Triple Bottom
- Triple Bottom
- Triple Top
- Triple Top
- All
- All
- Buy
- Sale
- All
- 1
- 2
- 3
- 4
- 5
Bearish Rectangle
was formed on 28.05 at 15:05:49 (UTC+0)
signal strength 1 of 5
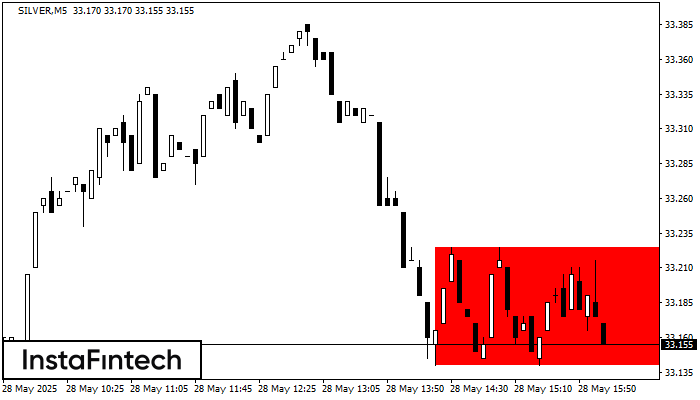
According to the chart of M5, SILVER formed the Bearish Rectangle. The pattern indicates a trend continuation. The upper border is 33.23, the lower border is 33.14. The signal means
The M5 and M15 time frames may have more false entry points.
Open chart in a new window
Bullish Symmetrical Triangle
was formed on 28.05 at 14:59:02 (UTC+0)
signal strength 2 of 5
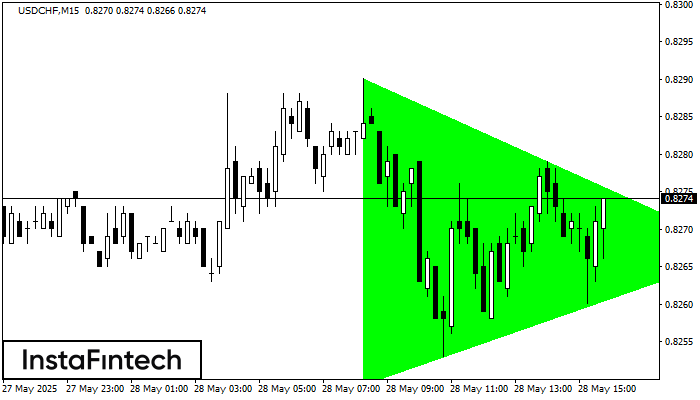
According to the chart of M15, USDCHF formed the Bullish Symmetrical Triangle pattern, which signals the trend will continue. Description. The upper border of the pattern touches the coordinates 0.8290/0.8267
The M5 and M15 time frames may have more false entry points.
Open chart in a new window
Double Bottom
was formed on 28.05 at 14:36:46 (UTC+0)
signal strength 1 of 5
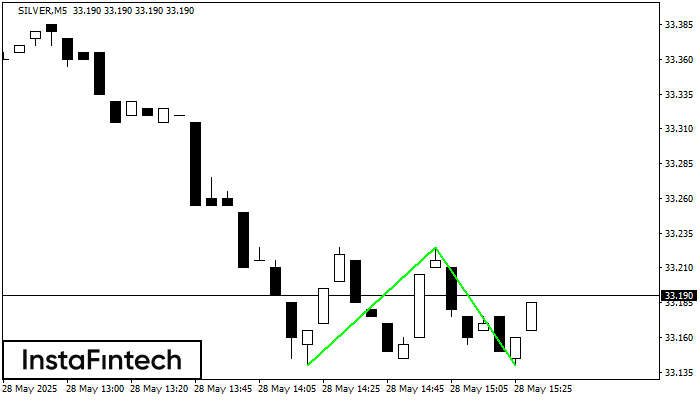
The Double Bottom pattern has been formed on SILVER M5. Characteristics: the support level 33.14; the resistance level 33.23; the width of the pattern 85 points. If the resistance level
The M5 and M15 time frames may have more false entry points.
Open chart in a new window


