

Pola sebenarnya

Bearish Rectangle
was formed on 11.04 at 00:26:55 (UTC+0)
signal strength 1 of 5
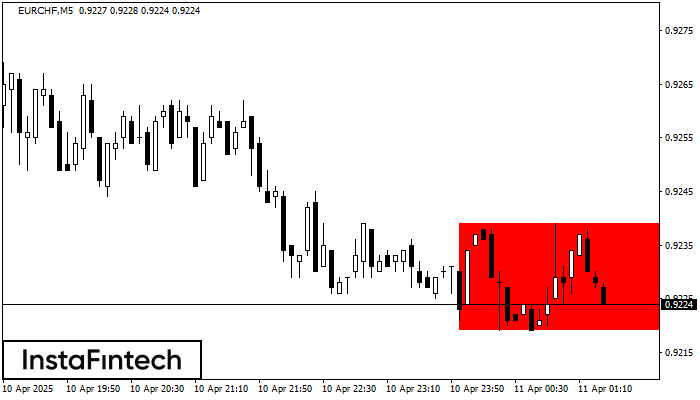
According to the chart of M5, EURCHF formed the Bearish Rectangle which is a pattern of a trend continuation. The pattern is contained within the following borders: lower border 0.9219 – 0.9219 and upper border 0.9239 – 0.9239. In case the lower border is broken, the instrument is likely to follow the downward trend.
The M5 and M15 time frames may have more false entry points.
- All
- All
- Bearish Rectangle
- Bearish Symmetrical Triangle
- Bearish Symmetrical Triangle
- Bullish Rectangle
- Double Top
- Double Top
- Triple Bottom
- Triple Bottom
- Triple Top
- Triple Top
- All
- All
- Buy
- Sale
- All
- 1
- 2
- 3
- 4
- 5
Bawah Triple
was formed on 30.05 at 20:25:24 (UTC+0)
signal strength 1 of 5
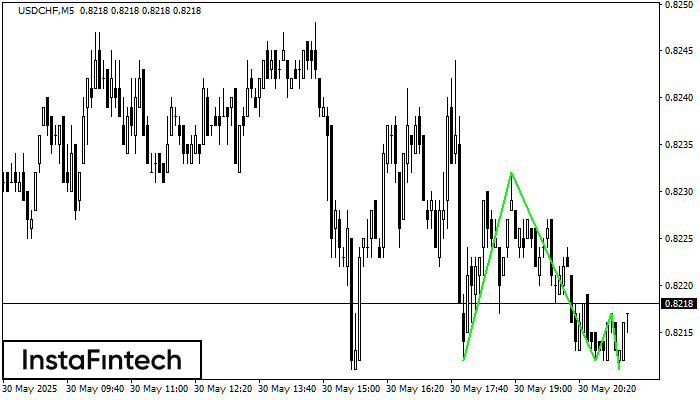
Pola Bawah Triple telah terbentuk pada grafik instrumen trading USDCHF M5. Pola tersebut menandakan perubahan dalam trend dari menurun menjadi naik jika terjadi pemecahan (breakdown) 0.8232/0.8217
Rangka waktu M5 dan M15 mungkin memiliki lebih dari titik entri yang keliru.
Open chart in a new window
Bawah Ganda
was formed on 30.05 at 20:10:20 (UTC+0)
signal strength 1 of 5
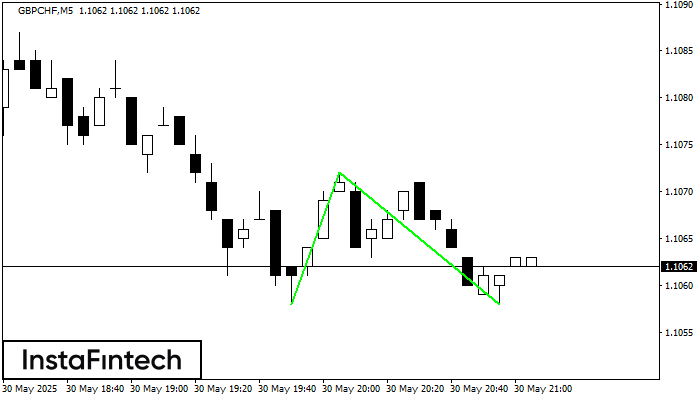
Pola Bawah Ganda telah terbentuk pada GBPCHF M5. Formasi ini mensinyalkan reversal tren dari arah penurunan ke arah kenaikan. Sinyal menunjukkan bahwa transaksi beli harus dibuka setelah batas atas pola
Rangka waktu M5 dan M15 mungkin memiliki lebih dari titik entri yang keliru.
Open chart in a new window
Segitiga Simetris Bearish
was formed on 30.05 at 20:06:13 (UTC+0)
signal strength 1 of 5
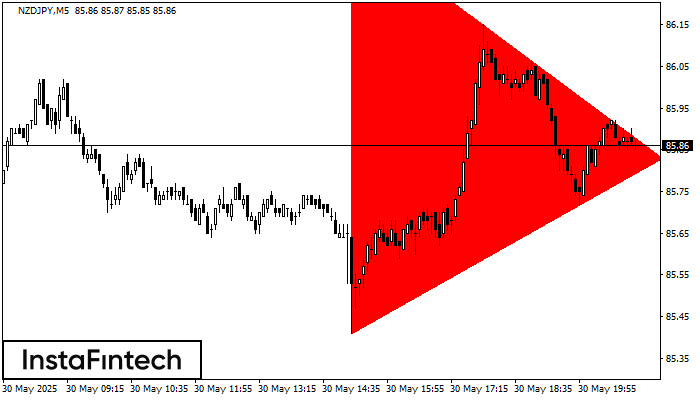
Menurut Grafik dari M5, NZDJPY dibentuk pola Segitiga Simetris Bearish. Deskripsi: Batas yang lebih rendah adalah 85.41/85.83 dan batas atas adalah 86.39/85.83. Lebar pola diukur dalam grafik di -98 pips
Rangka waktu M5 dan M15 mungkin memiliki lebih dari titik entri yang keliru.
Open chart in a new window


