

Pola sebenarnya

Bullish Symmetrical Triangle
was formed on 10.04 at 19:35:35 (UTC+0)
signal strength 1 of 5
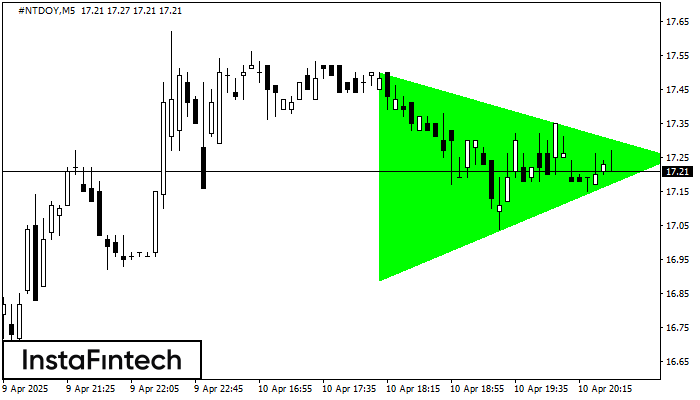
According to the chart of M5, #NTDOY formed the Bullish Symmetrical Triangle pattern. Description: This is the pattern of a trend continuation. 17.50 and 16.89 are the coordinates of the upper and lower borders respectively. The pattern width is measured on the chart at 61 pips. Outlook: If the upper border 17.50 is broken, the price is likely to continue its move by 17.40.
The M5 and M15 time frames may have more false entry points.
Lihat juga
- All
- All
- Bearish Rectangle
- Bearish Symmetrical Triangle
- Bearish Symmetrical Triangle
- Bullish Rectangle
- Double Top
- Double Top
- Triple Bottom
- Triple Bottom
- Triple Top
- Triple Top
- All
- All
- Buy
- Sale
- All
- 1
- 2
- 3
- 4
- 5
Teratas Triple
was formed on 30.05 at 22:20:23 (UTC+0)
signal strength 1 of 5

Pola Teratas Triple telah terbentuk pada grafik instrumen trading GOLD M5. Pola tersebut merupakan pola reversal menampilkan karakteristik berikut: level resistance 4, levek support -193, dan lebar pola 613. Prakiraan
Rangka waktu M5 dan M15 mungkin memiliki lebih dari titik entri yang keliru.
Open chart in a new window
Kepala dan Bahu Terbalik
was formed on 30.05 at 21:50:24 (UTC+0)
signal strength 1 of 5

Menurut grafik M5, #AMZN menghasilkan pola yang disebut Kepala dan Bahu Terbalik. The Head ditetapkan di 201.64 sementara garis median The Neck ditetapkan di 204.52/205.01. Formasi Pola Kepala dan Bahu
Rangka waktu M5 dan M15 mungkin memiliki lebih dari titik entri yang keliru.
Open chart in a new window
Persegi Bearish
was formed on 30.05 at 21:36:36 (UTC+0)
signal strength 1 of 5

Menurut grafik dari M5, GBPAUD terbentuk Persegi Bearish yang merupakan pola dari kelanjutan tren. Pola terkandung di dalam batas berikut: batas lebih rendah 2.0897 – 2.0897 dan batas atas 2.0908
Rangka waktu M5 dan M15 mungkin memiliki lebih dari titik entri yang keliru.
Open chart in a new window


