

Pola sebenarnya

Double Top
was formed on 10.04 at 15:00:21 (UTC+0)
signal strength 2 of 5
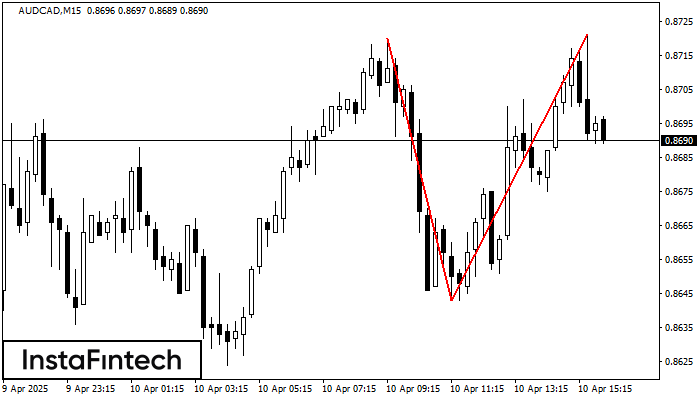
On the chart of AUDCAD M15 the Double Top reversal pattern has been formed. Characteristics: the upper boundary 0.8721; the lower boundary 0.8643; the width of the pattern 78 points. The signal: a break of the lower boundary will cause continuation of the downward trend targeting the 0.8620 level.
The M5 and M15 time frames may have more false entry points.
- All
- All
- Bearish Rectangle
- Bearish Symmetrical Triangle
- Bearish Symmetrical Triangle
- Bullish Rectangle
- Double Top
- Double Top
- Triple Bottom
- Triple Bottom
- Triple Top
- Triple Top
- All
- All
- Buy
- Sale
- All
- 1
- 2
- 3
- 4
- 5
Rectángulo Bajista
was formed on 20.05 at 16:29:56 (UTC+0)
signal strength 3 of 5
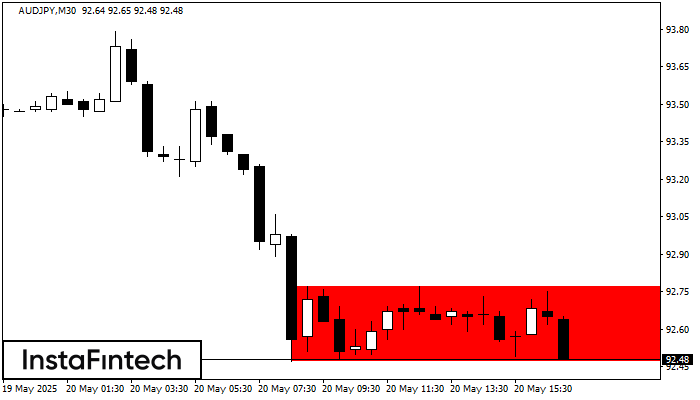
Según el gráfico de M30, AUDJPY formó el Rectángulo Bajista que es un patrón de la continuación de una tendencia. El patrón está contenido dentro de los siguientes límites: límite
Open chart in a new window
Rectángulo Alcista
was formed on 20.05 at 15:30:15 (UTC+0)
signal strength 3 of 5
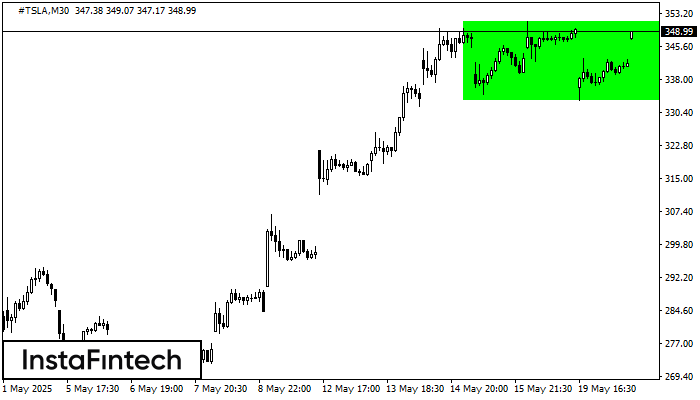
Según el gráfico de M30, #TSLA formó el Rectángulo Alcista. El patrón indica la continuación de una tendencia. El límite superior es 351.33, el límite inferior es 333.21. La señal
Open chart in a new window
Rectángulo Alcista
was formed on 20.05 at 07:00:52 (UTC+0)
signal strength 3 of 5

Según el gráfico de M30, NZDCAD formó el Rectángulo Alcista. Este tipo de patrón indica la continuación de una tendencia. Esto consiste de dos niveles: resistencia 0.8274 y soporte 0.8253
Open chart in a new window


