

Pola sebenarnya

Bearish Symmetrical Triangle
was formed on 09.04 at 16:55:24 (UTC+0)
signal strength 3 of 5
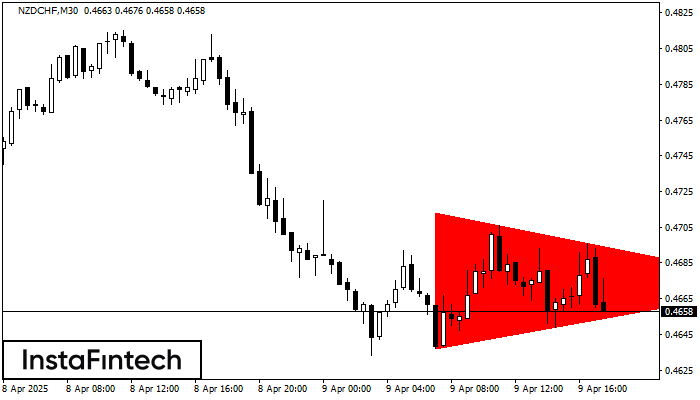
According to the chart of M30, NZDCHF formed the Bearish Symmetrical Triangle pattern. Description: The lower border is 0.4637/0.4673 and upper border is 0.4713/0.4673. The pattern width is measured on the chart at -76 pips. The formation of the Bearish Symmetrical Triangle pattern evidently signals a continuation of the downward trend. In other words, if the scenario comes true and NZDCHF breaches the lower border, the price could continue its move toward 0.4643.
- All
- All
- Bearish Rectangle
- Bearish Symmetrical Triangle
- Bearish Symmetrical Triangle
- Bullish Rectangle
- Double Top
- Double Top
- Triple Bottom
- Triple Bottom
- Triple Top
- Triple Top
- All
- All
- Buy
- Sale
- All
- 1
- 2
- 3
- 4
- 5
Bullish Symmetrical Triangle
was formed on 28.05 at 10:04:32 (UTC+0)
signal strength 2 of 5
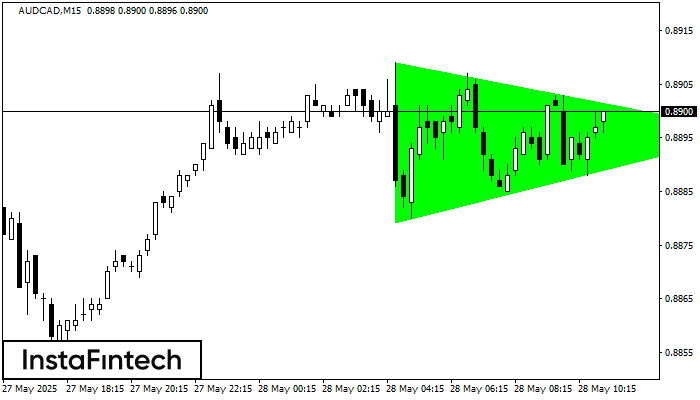
According to the chart of M15, AUDCAD formed the Bullish Symmetrical Triangle pattern. The lower border of the pattern touches the coordinates 0.8879/0.8896 whereas the upper border goes across 0.8909/0.8896
The M5 and M15 time frames may have more false entry points.
Open chart in a new window
Bearish pennant
was formed on 28.05 at 08:12:58 (UTC+0)
signal strength 1 of 5

The Bearish pennant pattern has formed on the GBPJPY M5 chart. It signals potential continuation of the existing trend. Specifications: the pattern’s bottom has the coordinate of 194.35; the projection
The M5 and M15 time frames may have more false entry points.
Open chart in a new window
Bullish Symmetrical Triangle
was formed on 28.05 at 07:55:36 (UTC+0)
signal strength 1 of 5

According to the chart of M5, GBPAUD formed the Bullish Symmetrical Triangle pattern, which signals the trend will continue. Description. The upper border of the pattern touches the coordinates 2.0988/2.0939
The M5 and M15 time frames may have more false entry points.
Open chart in a new window


