

Pola sebenarnya

Bullish Symmetrical Triangle
was formed on 09.04 at 11:56:23 (UTC+0)
signal strength 1 of 5
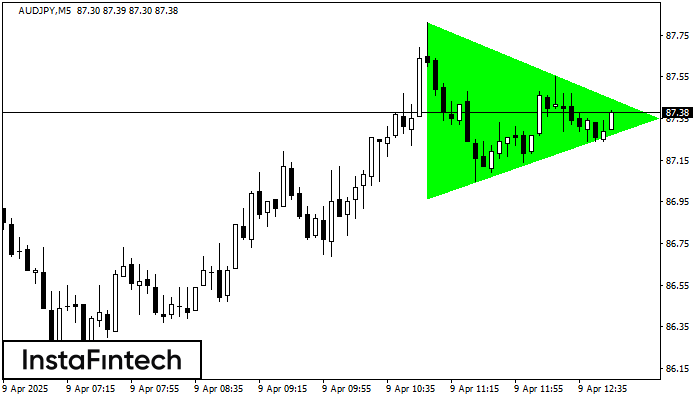
According to the chart of M5, AUDJPY formed the Bullish Symmetrical Triangle pattern, which signals the trend will continue. Description. The upper border of the pattern touches the coordinates 87.81/87.35 whereas the lower border goes across 86.97/87.35. The pattern width is measured on the chart at 84 pips. If the Bullish Symmetrical Triangle pattern is in progress during the upward trend, this indicates the current trend will go on. In case 87.35 is broken, the price could continue its move toward 87.50.
The M5 and M15 time frames may have more false entry points.
- All
- All
- Bearish Rectangle
- Bearish Symmetrical Triangle
- Bearish Symmetrical Triangle
- Bullish Rectangle
- Double Top
- Double Top
- Triple Bottom
- Triple Bottom
- Triple Top
- Triple Top
- All
- All
- Buy
- Sale
- All
- 1
- 2
- 3
- 4
- 5
Panji Bearish
was formed on 23.05 at 17:26:20 (UTC+0)
signal strength 2 of 5
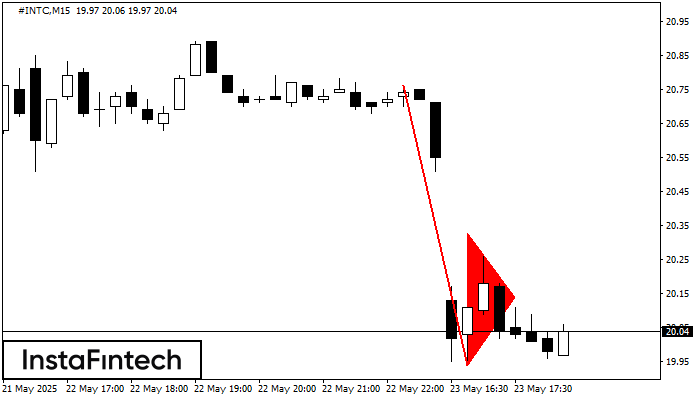
Pola Panji Bearish telah terbentuk di grafik #INTC M15. Pola ini memberikan sinyal potensi kelanjutan tren yang ada. Spesifikasi: titik terendah pola berkoordinat di 19.94; proyeksi titik tertinggi sama dengan
Rangka waktu M5 dan M15 mungkin memiliki lebih dari titik entri yang keliru.
Open chart in a new window
Panji Bullish
was formed on 23.05 at 17:22:27 (UTC+0)
signal strength 2 of 5

Pola grafik Panji Bullish telah terbentuk di instrumen #NTDOY M15. Jenis pola ini terjadi pada kategori pola kelanjutan. Dalam kasus ini, jika kuotasi dapat menembus titik tertinggi, harga diperkirakan akan
Rangka waktu M5 dan M15 mungkin memiliki lebih dari titik entri yang keliru.
Open chart in a new window
Panji Bullish
was formed on 23.05 at 17:22:19 (UTC+0)
signal strength 2 of 5
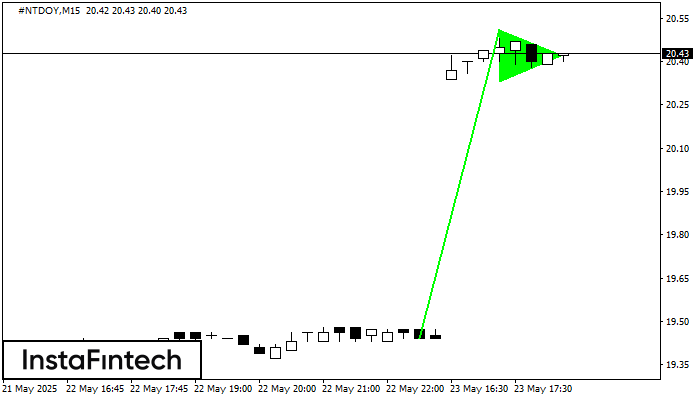
Sinyal Panji Bullish – instrumen trading #NTDOY M15, pola kelanjutan. Prakiraan: mungkin untuk mengatur posisi beli di atas titik tertinggi pola, di 20.51, dengan prospek pergerakan selanjutnya menjadi proyeksi titik
Rangka waktu M5 dan M15 mungkin memiliki lebih dari titik entri yang keliru.
Open chart in a new window


