

Pola sebenarnya

Bullish Rectangle
was formed on 09.04 at 06:12:17 (UTC+0)
signal strength 1 of 5
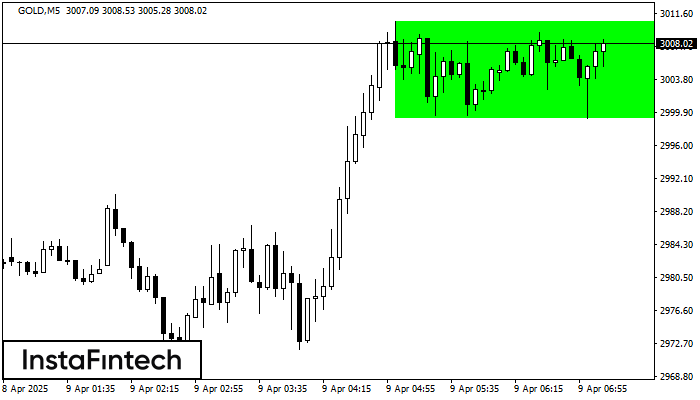
According to the chart of M5, GOLD formed the Bullish Rectangle. The pattern indicates a trend continuation. The upper border is 3010.63, the lower border is 2999.19. The signal means that a long position should be opened above the upper border 3010.63 of the Bullish Rectangle.
The M5 and M15 time frames may have more false entry points.
- All
- All
- Bearish Rectangle
- Bearish Symmetrical Triangle
- Bearish Symmetrical Triangle
- Bullish Rectangle
- Double Top
- Double Top
- Triple Bottom
- Triple Bottom
- Triple Top
- Triple Top
- All
- All
- Buy
- Sale
- All
- 1
- 2
- 3
- 4
- 5
Bawah Triple
was formed on 28.05 at 19:00:32 (UTC+0)
signal strength 1 of 5
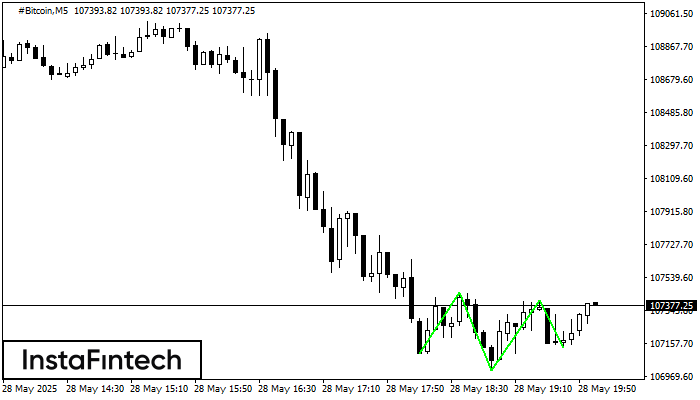
Pola Bawah Triple telah terbentuk pada #Bitcoin M5. Pola tersebut memiliki karakteristik sebagai berikut: level resistance 107451.30/107407.78; level support 107100.45/107133.63; dengan lebar 35085 poin. Jika terjadi pemecahan (breakdown) pada level
Rangka waktu M5 dan M15 mungkin memiliki lebih dari titik entri yang keliru.
Open chart in a new window
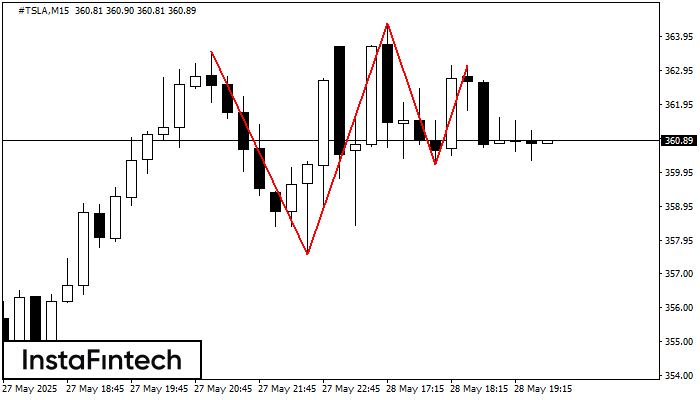
Teratas Triple
was formed on 28.05 at 18:45:28 (UTC+0)
signal strength 2 of 5

Pada grafik instrumen trading #TSLA M15, pola Teratas Triple yang menandakan perubahan trend telah terbentuk. Ada kemungkinan bahwa setelah pembentukan puncak (peak) ketiga, harga akan mencoba untuk menembus level resistance
Rangka waktu M5 dan M15 mungkin memiliki lebih dari titik entri yang keliru.
Open chart in a new window
Teratas Triple
was formed on 28.05 at 18:45:20 (UTC+0)
signal strength 2 of 5
Pada grafik instrumen trading #TSLA M15, pola Teratas Triple yang menandakan perubahan trend telah terbentuk. Ada kemungkinan bahwa setelah pembentukan puncak (peak) ketiga, harga akan mencoba untuk menembus level resistance
Rangka waktu M5 dan M15 mungkin memiliki lebih dari titik entri yang keliru.
Open chart in a new window


