

Pola sebenarnya

Double Bottom
was formed on 09.04 at 05:25:03 (UTC+0)
signal strength 1 of 5
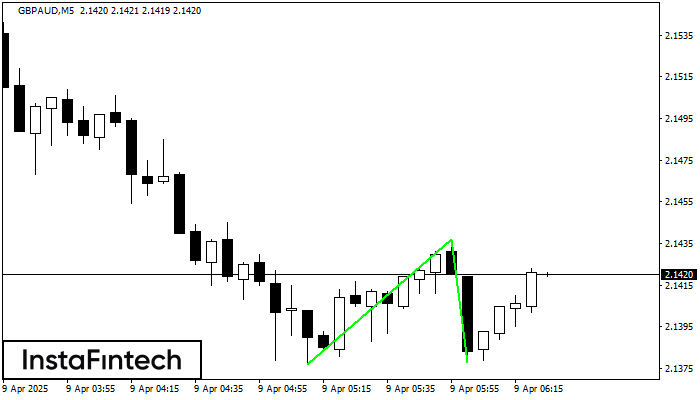
The Double Bottom pattern has been formed on GBPAUD M5. This formation signals a reversal of the trend from downwards to upwards. The signal is that a buy trade should be opened after the upper boundary of the pattern 2.1437 is broken. The further movements will rely on the width of the current pattern 60 points.
The M5 and M15 time frames may have more false entry points.
Lihat juga
- All
- All
- Bearish Rectangle
- Bearish Symmetrical Triangle
- Bearish Symmetrical Triangle
- Bullish Rectangle
- Double Top
- Double Top
- Triple Bottom
- Triple Bottom
- Triple Top
- Triple Top
- All
- All
- Buy
- Sale
- All
- 1
- 2
- 3
- 4
- 5
Bawah Ganda
was formed on 04.08 at 04:00:34 (UTC+0)
signal strength 1 of 5
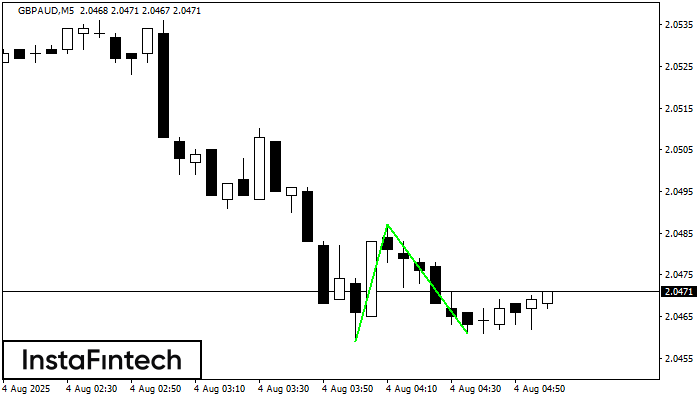
Pola Bawah Ganda telah terbentuk pada GBPAUD M5. Formasi ini mensinyalkan reversal tren dari arah penurunan ke arah kenaikan. Sinyal menunjukkan bahwa transaksi beli harus dibuka setelah batas atas pola
Rangka waktu M5 dan M15 mungkin memiliki lebih dari titik entri yang keliru.
Open chart in a new window
Bendera Bullish
was formed on 04.08 at 02:41:43 (UTC+0)
signal strength 1 of 5
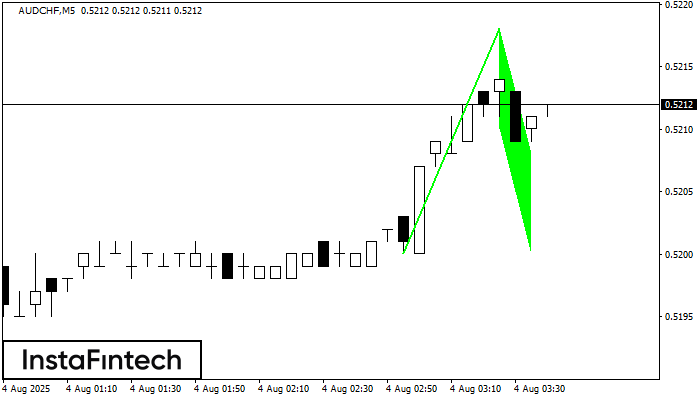
Pola Bendera Bullish telah terbentuk di AUDCHF at M5. Batas bawah pola ini terletak di 0.5210/0.5200, sementara batas atas terletak di 0.5218/0.5208. Proyeksi panjang jarum candle 18 poin. Pembentukan
Rangka waktu M5 dan M15 mungkin memiliki lebih dari titik entri yang keliru.
Open chart in a new window
Panji Bullish
was formed on 04.08 at 02:41:37 (UTC+0)
signal strength 1 of 5
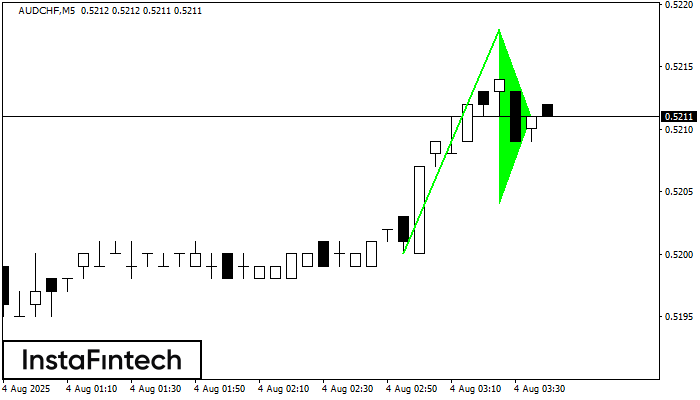
Sinyal Panji Bullish – instrumen trading AUDCHF M5, pola kelanjutan. Prakiraan: mungkin untuk mengatur posisi beli di atas titik tertinggi pola, di 0.5218, dengan prospek pergerakan selanjutnya menjadi proyeksi titik
Rangka waktu M5 dan M15 mungkin memiliki lebih dari titik entri yang keliru.
Open chart in a new window


