

Pola sebenarnya

Bearish Rectangle
was formed on 09.04 at 01:24:35 (UTC+0)
signal strength 2 of 5
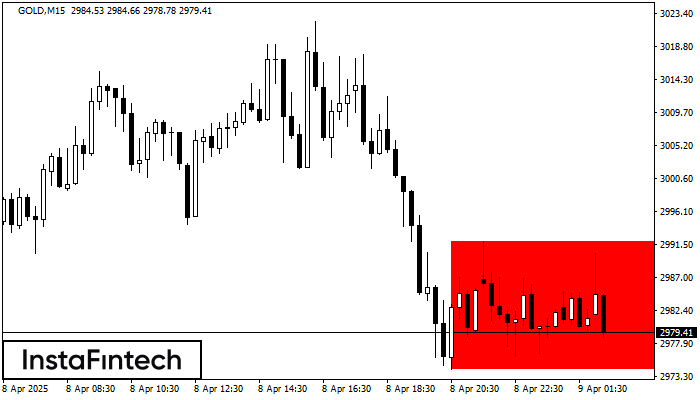
According to the chart of M15, GOLD formed the Bearish Rectangle. This type of a pattern indicates a trend continuation. It consists of two levels: resistance 2991.89 - 0.00 and support 2974.26 – 2974.26. In case the resistance level 2974.26 - 2974.26 is broken, the instrument is likely to follow the bearish trend.
The M5 and M15 time frames may have more false entry points.
Lihat juga
- All
- All
- Bearish Rectangle
- Bearish Symmetrical Triangle
- Bearish Symmetrical Triangle
- Bullish Rectangle
- Double Top
- Double Top
- Triple Bottom
- Triple Bottom
- Triple Top
- Triple Top
- All
- All
- Buy
- Sale
- All
- 1
- 2
- 3
- 4
- 5
Прямоугольник
сформирован 25.05 в 07:55:30 (UTC+0)
сила сигнала 1 из 5

По торговому инструменту #Bitcoin на M5 сформировалась фигура продолжения тренда - «Прямоугольник». Фигура имеет границы: Нижняя 107891.05; Верхняя 108246.73. В случае пробоя верхней границы вероятно дальнейшее движение в сторону тренда
Таймфреймы М5 и М15 могут иметь больше ложных точек входа.
Открыть график инструмента в новом окне
Бычий симметричный треугольник
сформирован 24.05 в 18:46:25 (UTC+0)
сила сигнала 2 из 5

По #Bitcoin на M15 сформировалась фигура «Бычий симметричный треугольник», которая сигнализирует нам о продолжении тенденции. Характеристика: Верхняя граница фигуры имеет координаты 109440.14/108872.57; Нижняя граница 108311.13/108872.57; Проекция ширины фигуры 112901 пунктов
Таймфреймы М5 и М15 могут иметь больше ложных точек входа.
Открыть график инструмента в новом окне
Прямоугольник
сформирован 23.05 в 23:00:20 (UTC+0)
сила сигнала 1 из 5

Сформирована фигура «Прямоугольник» на графике EURNZD M5. Тип фигуры: Продолжение тренда; Границы: Верхняя 1.8982, Нижняя 1.8964; Сигнал: позиция на продажу открывается после фиксации цены ниже границы прямоугольника 1.8964
Таймфреймы М5 и М15 могут иметь больше ложных точек входа.
Открыть график инструмента в новом окне


