

Pola sebenarnya

Double Bottom
was formed on 08.04 at 23:00:01 (UTC+0)
signal strength 1 of 5
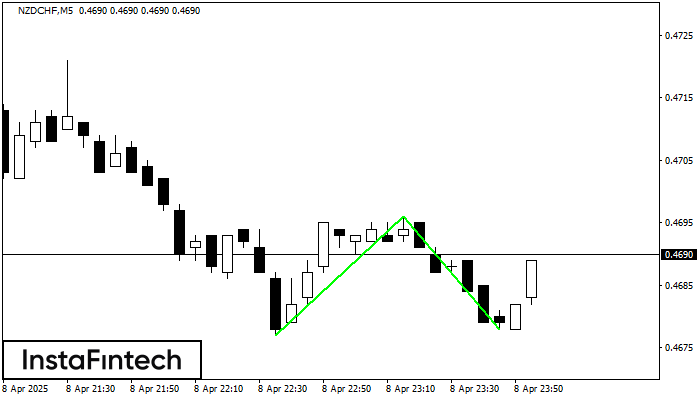
The Double Bottom pattern has been formed on NZDCHF M5; the upper boundary is 0.4696; the lower boundary is 0.4678. The width of the pattern is 19 points. In case of a break of the upper boundary 0.4696, a change in the trend can be predicted where the width of the pattern will coincide with the distance to a possible take profit level.
The M5 and M15 time frames may have more false entry points.
Lihat juga
- All
- All
- Bearish Rectangle
- Bearish Symmetrical Triangle
- Bearish Symmetrical Triangle
- Bullish Rectangle
- Double Top
- Double Top
- Triple Bottom
- Triple Bottom
- Triple Top
- Triple Top
- All
- All
- Buy
- Sale
- All
- 1
- 2
- 3
- 4
- 5
Teratas Ganda
was formed on 22.05 at 19:15:10 (UTC+0)
signal strength 1 of 5
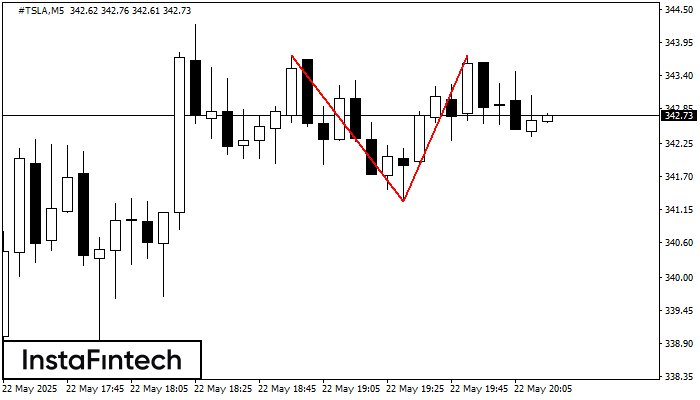
Pola reversal Teratas Ganda telah terbentuk pada #TSLA M5. Karakteristik: batas atas 343.73; batas bawah 341.29; lebar pola 245 poin. Transaksi jual lebih baik dibuka di bawah batas bawah 341.29
Rangka waktu M5 dan M15 mungkin memiliki lebih dari titik entri yang keliru.
Open chart in a new window
Teratas Ganda
was formed on 22.05 at 19:10:28 (UTC+0)
signal strength 1 of 5
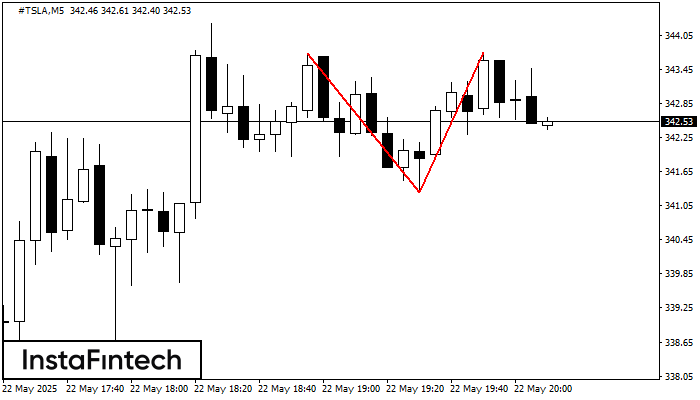
Pada grafik #TSLA M5 pola reversal Teratas Ganda telah terbentuk. Karakteristik: batas atas 343.74; batas bawah 341.29; lebar pola 245 poin. Sinyal: tembusan ke batas bawah akan menyebabkan kelanjutan tren
Rangka waktu M5 dan M15 mungkin memiliki lebih dari titik entri yang keliru.
Open chart in a new window
Teratas Ganda
was formed on 22.05 at 18:35:37 (UTC+0)
signal strength 1 of 5
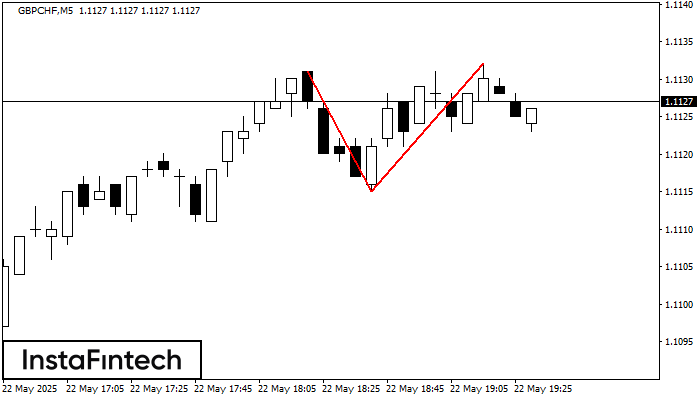
Pada grafik GBPCHF M5 pola reversal Teratas Ganda telah terbentuk. Karakteristik: batas atas 1.1132; batas bawah 1.1115; lebar pola 17 poin. Sinyal: tembusan ke batas bawah akan menyebabkan kelanjutan tren
Rangka waktu M5 dan M15 mungkin memiliki lebih dari titik entri yang keliru.
Open chart in a new window


