

Pola sebenarnya

Bullish pennant
was formed on 08.04 at 16:35:12 (UTC+0)
signal strength 1 of 5
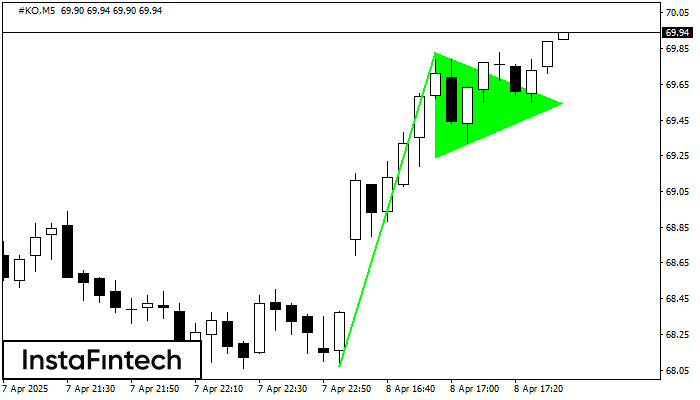
The Bullish pennant pattern is formed on the #KO M5 chart. It is a type of the continuation pattern. Supposedly, in case the price is fixed above the pennant’s high of 69.83, a further uptrend is possible.
The M5 and M15 time frames may have more false entry points.
- All
- All
- Bearish Rectangle
- Bearish Symmetrical Triangle
- Bearish Symmetrical Triangle
- Bullish Rectangle
- Double Top
- Double Top
- Triple Bottom
- Triple Bottom
- Triple Top
- Triple Top
- All
- All
- Buy
- Sale
- All
- 1
- 2
- 3
- 4
- 5
Double Top
was formed on 27.05 at 19:40:20 (UTC+0)
signal strength 1 of 5
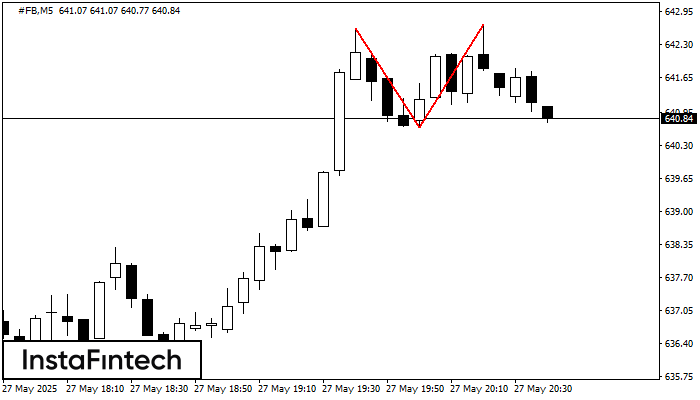
The Double Top pattern has been formed on #FB M5. It signals that the trend has been changed from upwards to downwards. Probably, if the base of the pattern 640.66
The M5 and M15 time frames may have more false entry points.
Open chart in a new window
Double Top
was formed on 27.05 at 19:35:16 (UTC+0)
signal strength 1 of 5
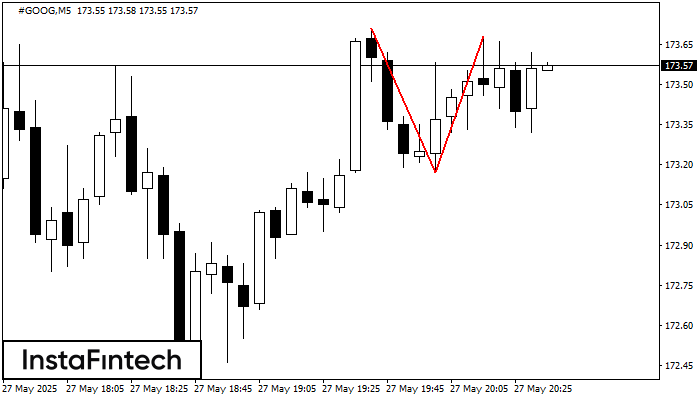
On the chart of #GOOG M5 the Double Top reversal pattern has been formed. Characteristics: the upper boundary 173.68; the lower boundary 173.17; the width of the pattern 51 points
The M5 and M15 time frames may have more false entry points.
Open chart in a new window
Bearish Flag
was formed on 27.05 at 19:34:24 (UTC+0)
signal strength 3 of 5
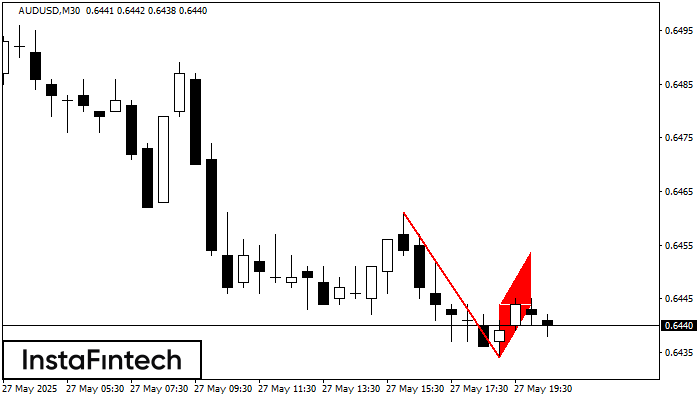
The Bearish Flag pattern has been formed on the chart AUDUSD M30. Therefore, the downwards trend is likely to continue in the nearest term. As soon as the price breaks
Open chart in a new window


