

Pola sebenarnya

Bearish pennant
was formed on 08.04 at 15:30:28 (UTC+0)
signal strength 4 of 5
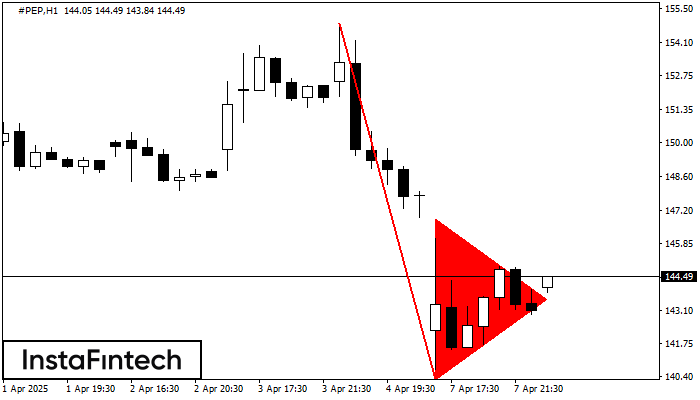
The Bearish pennant pattern has formed on the #PEP H1 chart. The pattern signals continuation of the downtrend in case the pennant’s low of 140.24 is broken through. Recommendations: Place the sell stop pending order 10 pips below the pattern’s low. Place the take profit order at the projection distance of the flagpole height.
- All
- All
- Bearish Rectangle
- Bearish Symmetrical Triangle
- Bearish Symmetrical Triangle
- Bullish Rectangle
- Double Top
- Double Top
- Triple Bottom
- Triple Bottom
- Triple Top
- Triple Top
- All
- All
- Buy
- Sale
- All
- 1
- 2
- 3
- 4
- 5
Kepala dan bahu
was formed on 28.05 at 17:00:24 (UTC+0)
signal strength 1 of 5
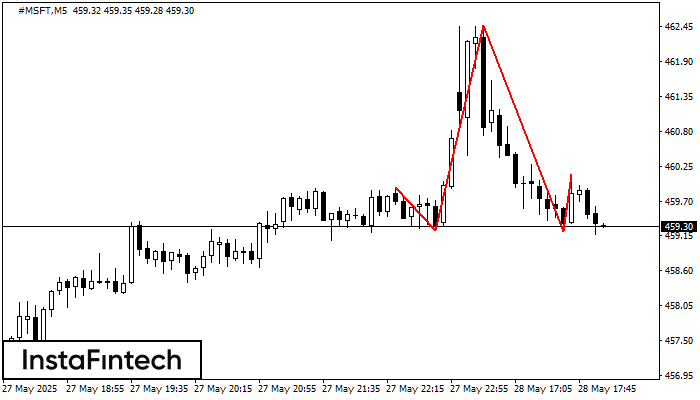
#MSFT M5 membentuk pola Kepala dan bahu dengan beberapa fitur berikut: puncak The Head di 462.46, the Neckline dan sudut atas berada di 459.23/459.22. Formasi pola ini dapat membawa perubahan
Rangka waktu M5 dan M15 mungkin memiliki lebih dari titik entri yang keliru.
Open chart in a new window
Teratas Triple
was formed on 28.05 at 16:45:20 (UTC+0)
signal strength 1 of 5
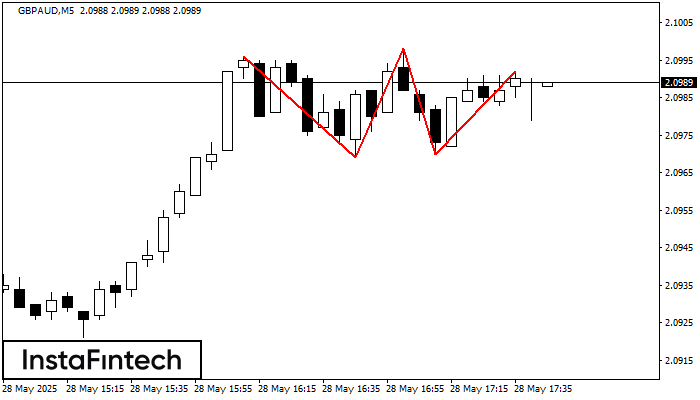
Pola Teratas Triple telah terbentuk pada grafik instrumen trading GBPAUD M5. Pola tersebut merupakan pola reversal menampilkan karakteristik berikut: level resistance 4, levek support -1, dan lebar pola 27. Prakiraan
Rangka waktu M5 dan M15 mungkin memiliki lebih dari titik entri yang keliru.
Open chart in a new window
Teratas Triple
was formed on 28.05 at 16:30:35 (UTC+0)
signal strength 3 of 5
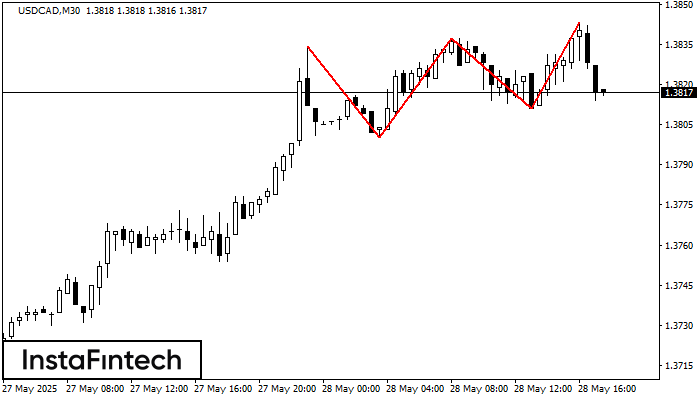
Pola Teratas Triple telah terbentuk pada grafik USDCAD M30. Fitur-fitur pola: perbatasan memiliki sudut yang naik; batas bawah pola memiliki koordinat 1.3800/1.3811 dengan batas atas 1.3834/1.3843; proyeksi lebar adalah
Open chart in a new window


