

Pola sebenarnya

Double Bottom
was formed on 08.04 at 13:50:49 (UTC+0)
signal strength 1 of 5
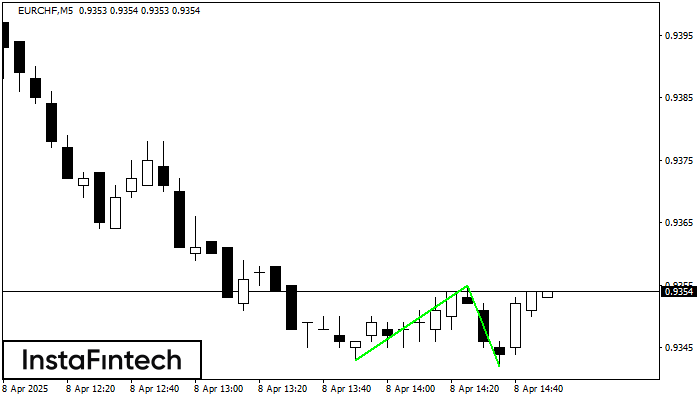
The Double Bottom pattern has been formed on EURCHF M5. This formation signals a reversal of the trend from downwards to upwards. The signal is that a buy trade should be opened after the upper boundary of the pattern 0.9355 is broken. The further movements will rely on the width of the current pattern 12 points.
The M5 and M15 time frames may have more false entry points.
- All
- All
- Bearish Rectangle
- Bearish Symmetrical Triangle
- Bearish Symmetrical Triangle
- Bullish Rectangle
- Double Top
- Double Top
- Triple Bottom
- Triple Bottom
- Triple Top
- Triple Top
- All
- All
- Buy
- Sale
- All
- 1
- 2
- 3
- 4
- 5
Bearish Rectangle
was formed on 23.05 at 23:00:20 (UTC+0)
signal strength 1 of 5

According to the chart of M5, EURNZD formed the Bearish Rectangle. The pattern indicates a trend continuation. The upper border is 1.8982, the lower border is 1.8964. The signal means
The M5 and M15 time frames may have more false entry points.
Open chart in a new window
Bullish Symmetrical Triangle
was formed on 23.05 at 22:14:53 (UTC+0)
signal strength 1 of 5

According to the chart of M5, AUDCHF formed the Bullish Symmetrical Triangle pattern. Description: This is the pattern of a trend continuation. 0.5335 and 0.5329 are the coordinates
The M5 and M15 time frames may have more false entry points.
Open chart in a new window
Bullish Symmetrical Triangle
was formed on 23.05 at 22:10:58 (UTC+0)
signal strength 1 of 5

According to the chart of M5, AUDJPY formed the Bullish Symmetrical Triangle pattern. Description: This is the pattern of a trend continuation. 92.60 and 92.44 are the coordinates
The M5 and M15 time frames may have more false entry points.
Open chart in a new window


