

Pola sebenarnya

Bearish Symmetrical Triangle
was formed on 08.04 at 13:41:43 (UTC+0)
signal strength 1 of 5
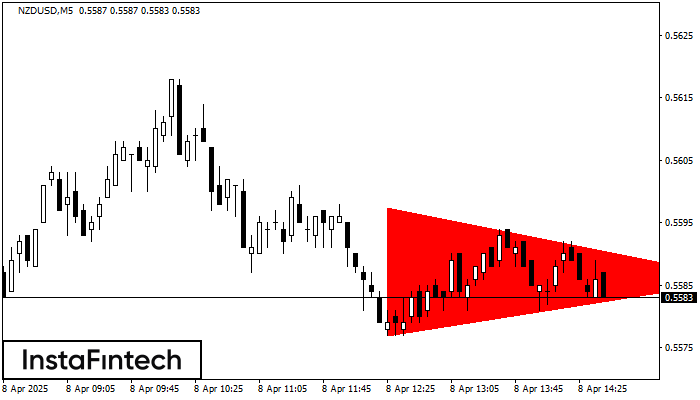
According to the chart of M5, NZDUSD formed the Bearish Symmetrical Triangle pattern. This pattern signals a further downward trend in case the lower border 0.5577 is breached. Here, a hypothetical profit will equal the width of the available pattern that is -21 pips.
The M5 and M15 time frames may have more false entry points.
- All
- All
- Bearish Rectangle
- Bearish Symmetrical Triangle
- Bearish Symmetrical Triangle
- Bullish Rectangle
- Double Top
- Double Top
- Triple Bottom
- Triple Bottom
- Triple Top
- Triple Top
- All
- All
- Buy
- Sale
- All
- 1
- 2
- 3
- 4
- 5
Double Top
was formed on 29.05 at 03:05:28 (UTC+0)
signal strength 1 of 5
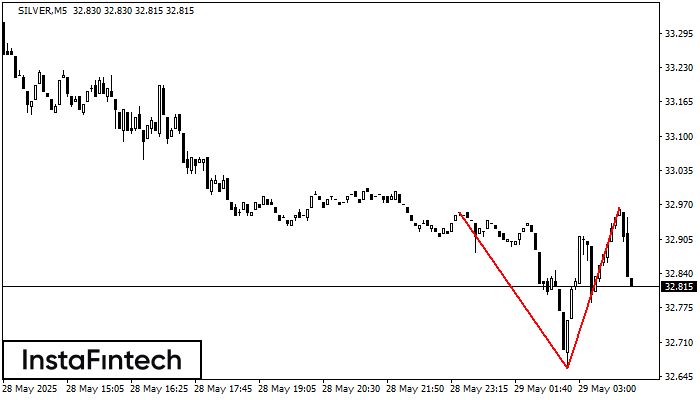
On the chart of SILVER M5 the Double Top reversal pattern has been formed. Characteristics: the upper boundary 32.97; the lower boundary 32.66; the width of the pattern 305 points
The M5 and M15 time frames may have more false entry points.
Open chart in a new window
Double Top
was formed on 29.05 at 03:00:04 (UTC+0)
signal strength 4 of 5
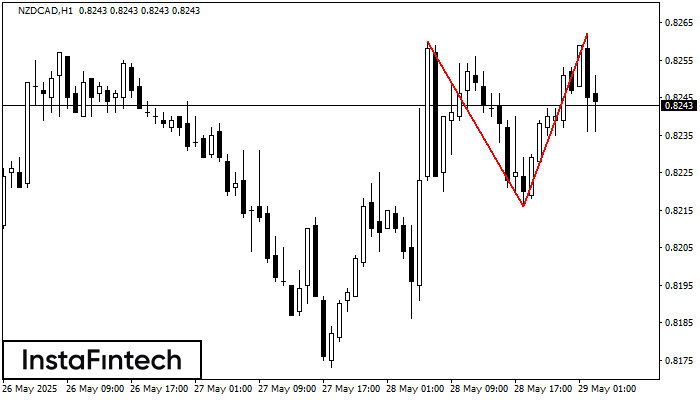
On the chart of NZDCAD H1 the Double Top reversal pattern has been formed. Characteristics: the upper boundary 0.8262; the lower boundary 0.8216; the width of the pattern 46 points
Open chart in a new window
Double Top
was formed on 29.05 at 02:00:28 (UTC+0)
signal strength 3 of 5
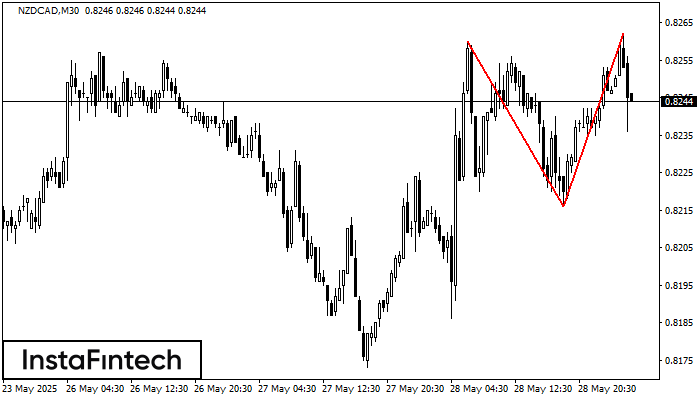
On the chart of NZDCAD M30 the Double Top reversal pattern has been formed. Characteristics: the upper boundary 0.8262; the lower boundary 0.8216; the width of the pattern 46 points
Open chart in a new window


