

Pola sebenarnya

Bearish Symmetrical Triangle
was formed on 08.04 at 13:00:16 (UTC+0)
signal strength 4 of 5
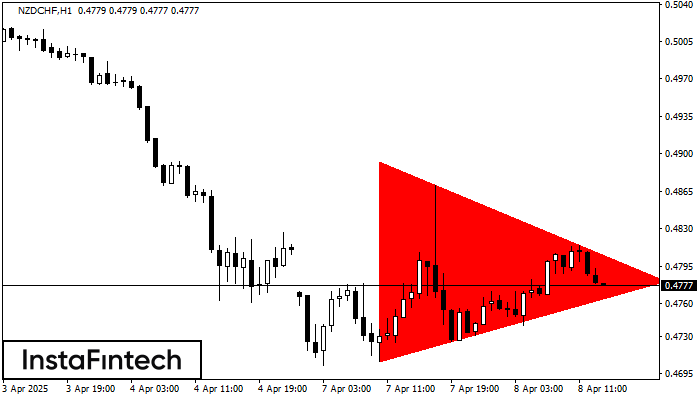
According to the chart of H1, NZDCHF formed the Bearish Symmetrical Triangle pattern. This pattern signals a further downward trend in case the lower border 0.4706 is breached. Here, a hypothetical profit will equal the width of the available pattern that is -187 pips.
- All
- All
- Bearish Rectangle
- Bearish Symmetrical Triangle
- Bearish Symmetrical Triangle
- Bullish Rectangle
- Double Top
- Double Top
- Triple Bottom
- Triple Bottom
- Triple Top
- Triple Top
- All
- All
- Buy
- Sale
- All
- 1
- 2
- 3
- 4
- 5
Bawah Ganda
was formed on 28.05 at 01:30:30 (UTC+0)
signal strength 2 of 5
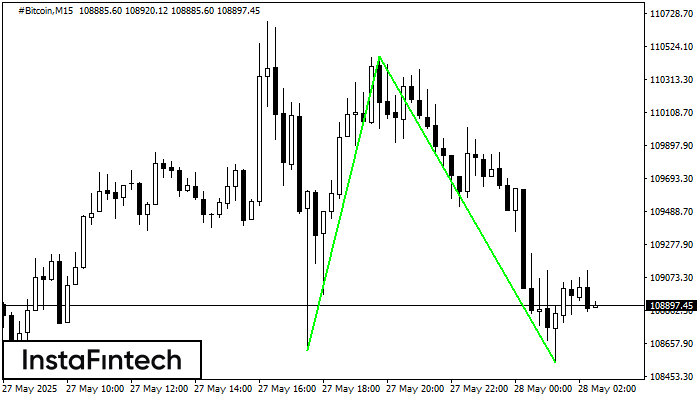
Pola Bawah Ganda telah terbentuk pada #Bitcoin M15; batas atas di 110459.83; batas bawah di 108539.43. Lebar pola sebesar 184898 poin. Jika harga menembus batas atas 110459.83, Perubahan dalam tren
Rangka waktu M5 dan M15 mungkin memiliki lebih dari titik entri yang keliru.
Open chart in a new window
Segitiga Simetris Bullish
was formed on 28.05 at 01:18:08 (UTC+0)
signal strength 2 of 5
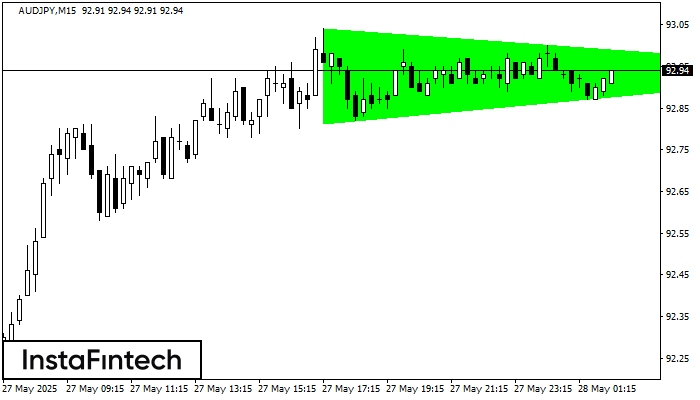
Menurut Grafik dari M15, AUDJPY dibentuk pola Segitiga Simetris Bullish. Deskripsi: Ini merupakan pola dari kelanjutan tren. 93.04 dan 92.81 adalah kordinat masing-masing dari batas atas dan lebih rendah. Lebar
Rangka waktu M5 dan M15 mungkin memiliki lebih dari titik entri yang keliru.
Open chart in a new window
Segitiga Simetris Bearish
was formed on 28.05 at 01:06:54 (UTC+0)
signal strength 1 of 5
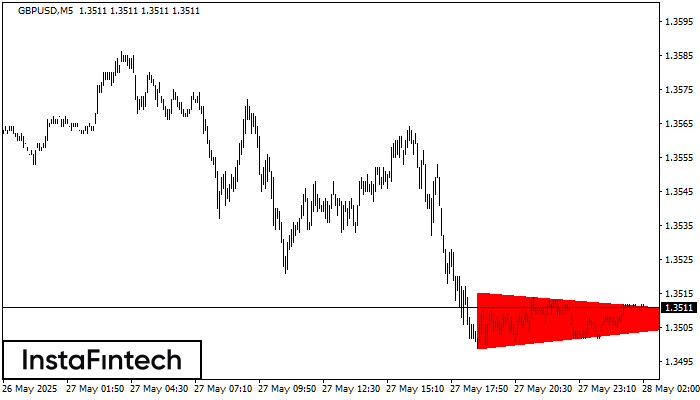
Menurut Grafik dari M5, GBPUSD dibentuk pola Segitiga Simetris Bearish. Deskripsi: Batas yang lebih rendah adalah 1.3499/1.3508 dan batas atas adalah 1.3515/1.3508. Lebar pola diukur dalam grafik di -16 pips
Rangka waktu M5 dan M15 mungkin memiliki lebih dari titik entri yang keliru.
Open chart in a new window


