

Pola sebenarnya

Double Top
was formed on 07.04 at 09:09:57 (UTC+0)
signal strength 1 of 5
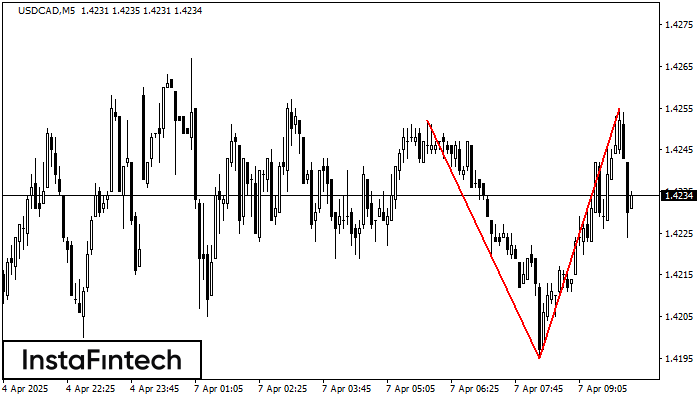
On the chart of USDCAD M5 the Double Top reversal pattern has been formed. Characteristics: the upper boundary 1.4255; the lower boundary 1.4195; the width of the pattern 60 points. The signal: a break of the lower boundary will cause continuation of the downward trend targeting the 1.4180 level.
The M5 and M15 time frames may have more false entry points.
- All
- All
- Bearish Rectangle
- Bearish Symmetrical Triangle
- Bearish Symmetrical Triangle
- Bullish Rectangle
- Double Top
- Double Top
- Triple Bottom
- Triple Bottom
- Triple Top
- Triple Top
- All
- All
- Buy
- Sale
- All
- 1
- 2
- 3
- 4
- 5
Triple Top
was formed on 30.05 at 22:20:23 (UTC+0)
signal strength 1 of 5

The Triple Top pattern has formed on the chart of the GOLD M5 trading instrument. It is a reversal pattern featuring the following characteristics: resistance level 4, support level -193
The M5 and M15 time frames may have more false entry points.
Open chart in a new window
Inverse Head and Shoulder
was formed on 30.05 at 21:50:24 (UTC+0)
signal strength 1 of 5

According to the chart of M5, #AMZN produced the pattern termed the Inverse Head and Shoulder. The Head is fixed at 201.64 while the median line of the Neck
The M5 and M15 time frames may have more false entry points.
Open chart in a new window
Bearish Rectangle
was formed on 30.05 at 21:36:36 (UTC+0)
signal strength 1 of 5

According to the chart of M5, GBPAUD formed the Bearish Rectangle which is a pattern of a trend continuation. The pattern is contained within the following borders: lower border 2.0897
The M5 and M15 time frames may have more false entry points.
Open chart in a new window


